


🦂 $SCORP Pre-Sale Is Almost Sold Out: Famous Casino Launches Token with Daily Staking Rewards - 6 Million Raised with 10,000 Participants! 🚀
Ethereum price analysis for 9 December 2022, Ethereum, the second largest cryptocurrency based on market cap, is in a downtrend since November 2021. You can read more about Ethereum price from CoinCodex. On the fifth day of this week, it seems that pressure tries to balance between buyers and sellers based on the weekly Heikin Ashi Candlestick. Buyers are relatively stronger. The weekly MACD is still negative but forms a positive histogram. The weekly RSI fluctuates below 50, and the price is still under the 50 SMMA line.
 Ethereum price analysis on the Daily Chart for 9 December 2022
 Ethereum price analysis on the Daily Chart for 9 December 2022
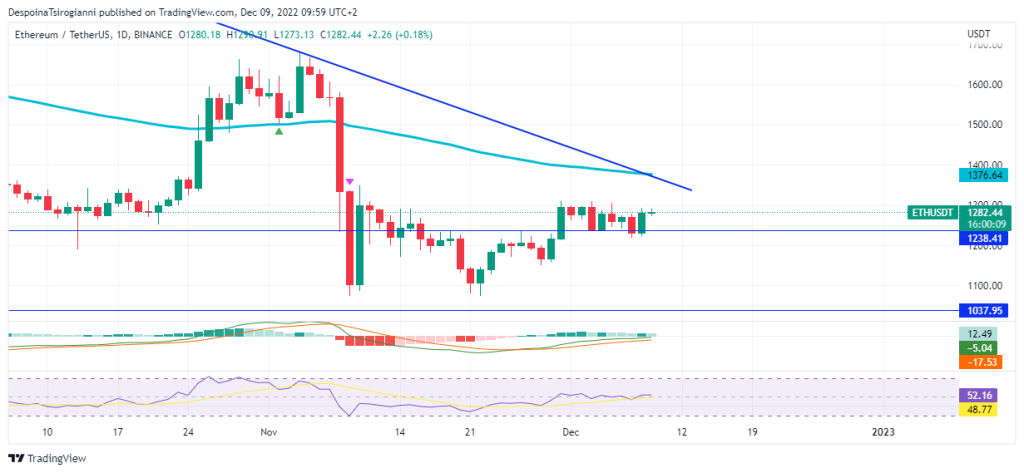 By diving into the daily timeframe, we identify that the price fluctuates over the $1238.41 zone and under the 50 SMMA ($1376.64).
The TFLOW V2 Algo has generated a Short signal.
🎲 Famous Casino Launches Token with Daily Staking Rewards - $6 Million Raised with 10,000 Participants! Pre-Sale is almost sold out 🚀
The Daily MACD is negative with a positive histogram.
The Daily RSI fluctuates over 50.
The 50 Daily SMMA stands above the price which means that the bears control the price.
🦂 $SCORP Pre-Sale Is Almost Sold Out: Famous Casino Launches Token with Daily Staking Rewards - 6 Million Raised with 10,000 Participants! 🚀
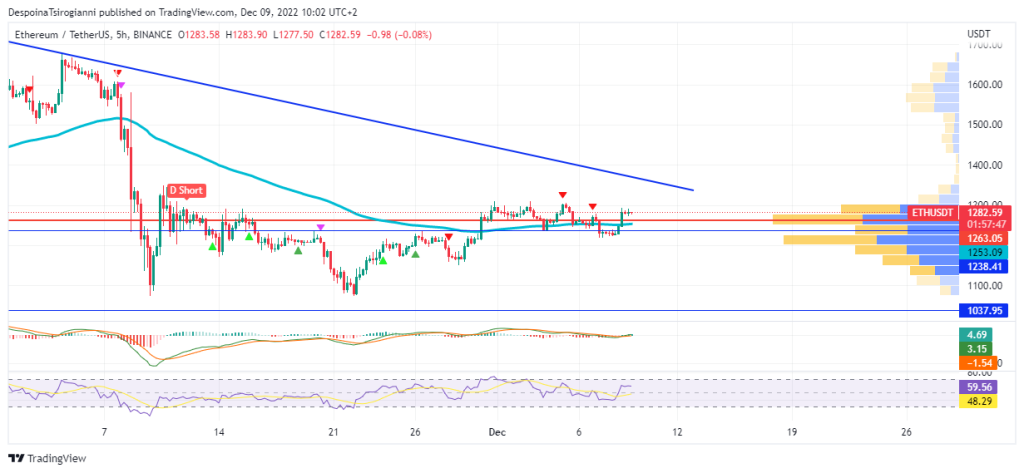 In the 5-hour chart, Ethereum fluctuates over the 50 SMMA line ($1253.09). Moreover, the Volume Profile indicator determines $1282.59 as a strong trading area that has been surpassed. The price achieved the previous resistance areas once again.
The 5-hour MACD slightly becomes positive. The 5-hour RSI fluctuates over 50.
Conclusion
The price of Ethereum continues in a downtrend in the medium-term scale, as the technical analysis and indicators coincide. In a short-term scale, buyers push the price over the 50 SMMA once again. We observe the current area for price reaction.
Read all the latest Crypto Analysis Articles here.
Join the TFLOW Trading Community: https://t.me/tflowglobal
🎲 Famous Casino Launches Token with Daily Staking Rewards - $6 Million Raised with 10,000 Participants! Pre-Sale is almost sold out 🚀
Read More
All News
April 17, 2024

April 17, 2024

April 17, 2024
