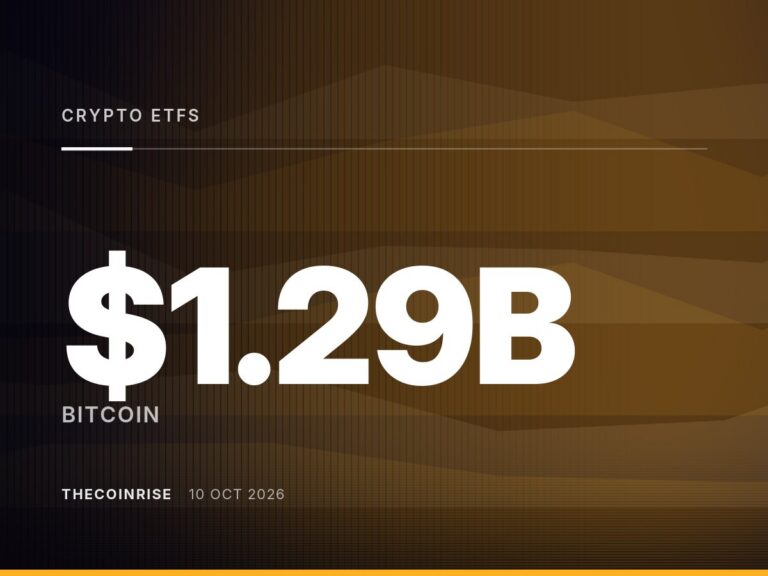


Daily inflow figures contrast with reports of a larger weekly outflow led by Fidelity's bitcoin fund.
U.S. spot bitcoin exchange-traded funds took in approximately $21 million in net new money on October 9. CryptoBriefing reported the figure as $21 million, while Coinfomania put it slightly higher at $21.13 million. Both figures point to a modest, positive single-day flow for the category.
The inflow came even as attention turned to ether, with Coinfomania noting pressure on Ethereum-linked products during the same period. Bitcoin ETFs have become a key barometer of institutional demand since their January 2024 launch. Daily flow data is closely watched by traders and analysts trying to gauge sentiment shifts among large investors.
A separate report from CoinTurk News EN described a markedly different picture over a longer window. That outlet reported $681 million in outflows from bitcoin ETFs, with Fidelity's fund recording its biggest weekly withdrawal to date. The scale of that figure suggests a weekly total rather than a single trading day, which would explain the apparent gap between the two sets of numbers.
Flow reporting in the ETF space often varies by timeframe, data provider, and which funds are included in the tally. A single day can show inflows even as a broader weekly or multi-day period shows net outflows, particularly if early-week selling outweighs a later rebound. Readers should treat the daily and weekly figures as describing different windows rather than conflicting claims about the same moment.
Fidelity's Wise Origin Bitcoin Fund is one of the largest products in the category alongside BlackRock's IBIT. A large weekly withdrawal from a fund of that size can meaningfully affect aggregate industry totals, even if other funds post inflows on individual days. This dynamic can produce exactly the kind of mixed signals seen in the current reporting.
Market participants typically interpret spot ETF flows as a proxy for institutional appetite rather than a direct price driver. Inflows do not guarantee rising prices, and outflows do not guarantee declines, since flows reflect fund-level allocation decisions rather than the full spot and derivatives market. Still, sustained trends in either direction are watched closely by analysts tracking demand for regulated bitcoin exposure.
Market Impact
Mixed flow signals, with a positive daily print alongside a larger reported weekly outflow, can add short-term uncertainty for traders monitoring institutional demand. A large withdrawal concentrated in one major fund, such as Fidelity's, may reflect fund-specific rebalancing rather than a broad shift away from bitcoin exposure across all products.
For the wider market, ETF flow data remains one of several indicators alongside spot trading volumes and derivatives positioning. Divergent headline numbers across reporting windows underscore the importance of checking whether a given figure covers a single day or a full week before drawing conclusions about sentiment.
The gap between a reported daily inflow and a larger weekly outflow highlights how timeframe choice can shape the picture of ETF demand. Investors should watch upcoming daily and weekly data to see which trend, if either, persists.
Frequently Asked Questions
How much flowed into bitcoin spot ETFs on October 9?
CryptoBriefing and Coinfomania reported net inflows of about $21 million to $21.13 million for that single trading day.
Why did CoinTurk News EN report a $681 million outflow?
That figure appears to reflect a weekly total rather than the single-day number, with Fidelity's bitcoin fund posting its largest weekly withdrawal.
Can daily inflows and weekly outflows both be accurate at the same time?
Yes. A fund category can show a positive single day even while the broader week nets negative if earlier outflows outweigh a later day's gains.
Does an ETF outflow mean bitcoin's price will fall?
Not necessarily. ETF flows reflect fund-level allocation decisions and are one of several indicators analysts use alongside spot and derivatives market data.