

Weekly NFT trading volume pulled back sharply even as Panini America's digital collectibles bucked the trend.
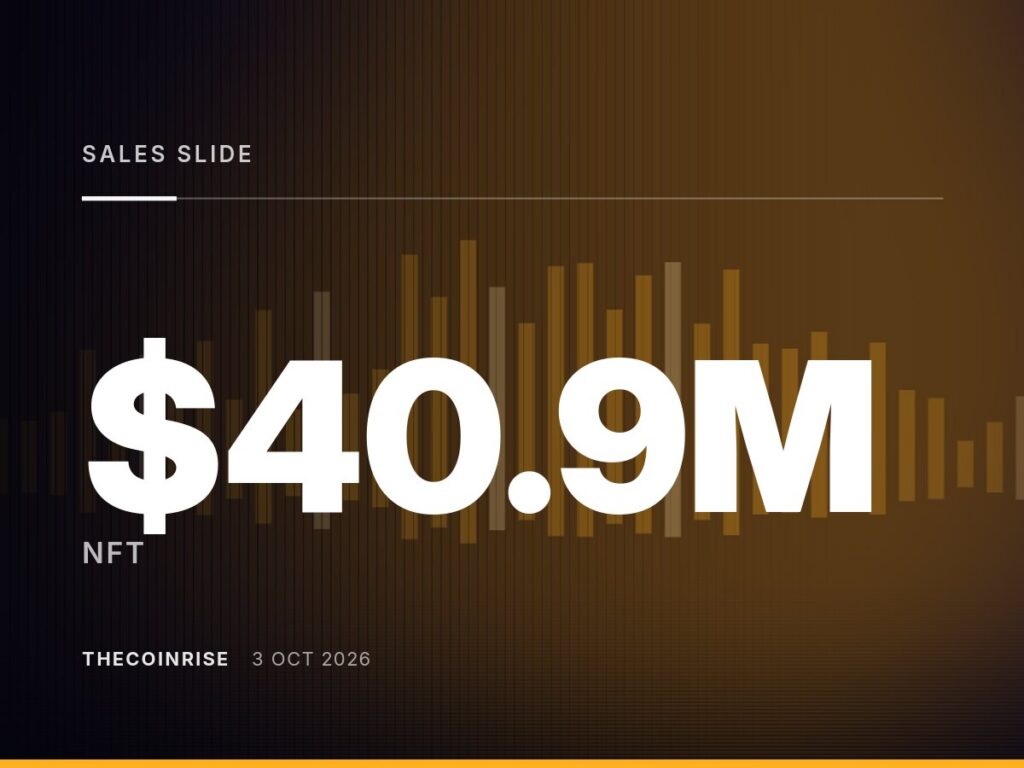
Weekly NFT trading volume dropped sharply, falling to roughly $40.9 million. crypto.news put the decline at 23%, while The Cryptonomist reported a slightly steeper drop of 23.48%, with volume landing near $40.88 million. The two figures are close enough to describe the same broad move in the NFT market.
Amid the overall pullback, one collection line moved in the opposite direction. Panini America's NFT sales jumped 557% over the reporting period, both outlets noted. The surge marks a sharp contrast with the wider market's weekly contraction.
Panini is best known as a traditional trading card and sticker publisher, with a long history in sports and entertainment collectibles. Its entry into digital collectibles has positioned the brand as a bridge between legacy card-collecting culture and blockchain-based ownership. A sudden spike in sales volume for its NFT line suggests renewed buyer interest, though the reports did not specify what drove the increase.
The broader NFT market has seen volume swing significantly from week to week throughout 2025 and into 2026. Weekly totals in the tens of millions of dollars are modest compared with the sector's 2021-2022 peaks, when single collections sometimes moved comparable sums in a day. Even so, week-over-week percentage changes remain closely watched as a gauge of collector demand and liquidity.
A 23% drop in total sales volume, even against a backdrop of one standout performer, points to continued softness across much of the NFT market. Declines of this size can reflect reduced activity among top blue-chip collections, lower secondary-market turnover, or broader risk-off sentiment among crypto investors. None of the available reporting specified which collections outside Panini America contributed most to the overall decline.
The divergence between Panini America's gain and the market's overall fall highlights how uneven performance has become within the NFT sector. Individual brands or licensed collectibles can post large swings independent of the broader trend. This makes aggregate weekly figures useful for tracking direction, but less useful for understanding performance at the level of individual collections.
Both crypto.news and The Cryptonomist framed the figures as part of routine market tracking rather than a one-off event. Neither report detailed the specific drivers behind Panini America's increase or the factors behind the sector-wide pullback. Readers should treat the numbers as a snapshot of a single reporting window rather than a signal of a longer-term trend.
Market Impact
A 23% weekly decline in NFT sales volume suggests reduced trading activity across much of the market, though the figure alone does not indicate whether buyer demand or seller supply drove the drop. Investors and collectors often watch such swings for signs of shifting sentiment, but single-week data carries limited predictive value on its own.
Panini America's 557% jump could draw attention to licensed collectible NFTs as a category, particularly if the gain proves durable in coming weeks. For now, the surge stands as an outlier against a broader market contraction, and its significance will depend on whether volume holds or reverses in subsequent reporting periods.
The latest figures underline how uneven conditions remain across the NFT market, with overall volume falling even as individual brands like Panini America post sharp gains. Further weekly data will show whether either trend persists.
Frequently Asked Questions
How much did NFT sales fall over the reporting period?
Weekly NFT sales volume dropped to about $40.9 million, a decline of roughly 23% according to crypto.news, or 23.48% according to The Cryptonomist.
What drove the increase in Panini America's NFT sales?
The reports did not specify a cause for the 557% jump in Panini America's NFT sales volume, only that the increase occurred during the same period as the broader market decline.
Does this decline reflect the entire NFT market or specific collections?
The reported figures describe aggregate weekly NFT sales volume. Neither source detailed which specific collections, beyond Panini America, contributed most to the overall change.
Is a 23% weekly swing in NFT sales unusual?
Weekly NFT volume has historically shown significant fluctuations, so a double-digit percentage move is not uncommon, though it still signals a notable shift in short-term trading activity.