Bitcoin price analysis for May 26, 2022, comes on a bearish note for the token with increased chances of losing the $29000 price region in the near future. It seems that the bears are currently overpowering the price action and there are currently no signs of a relief rally in the market. Furthermore, as noted in our BTC price analysis for May 25, 2022, the world’s biggest cryptocurrency has a major resistance region beyond the $30K price level which the bulls have not been able to conquer. At the time of writing, BTC is nearly 60% low from its all-time high.
The data from CoinMarketCap shows that the trading volume of the token jumped by 4.12% in the last 24 hours, followed by a 1.26% drop in the market cap. Moreover, the Volume / Market Cap has a value of 0.05579, while the Market Dominance dropped to 45.53%.
The daily candle for the token opened at a price of $29542 and reached a daily high of $29886. On the other hand, the daily low for Bitcoin stands at a price of $28877. The price of 1 Bitcoin at the time of writing is $29008.
Bitcoin price analysis for May 26 on the daily chart
Bitcoin price analysis for May 26, 2022, will consider the data from the daily chart below with three major indicators integrated into it.
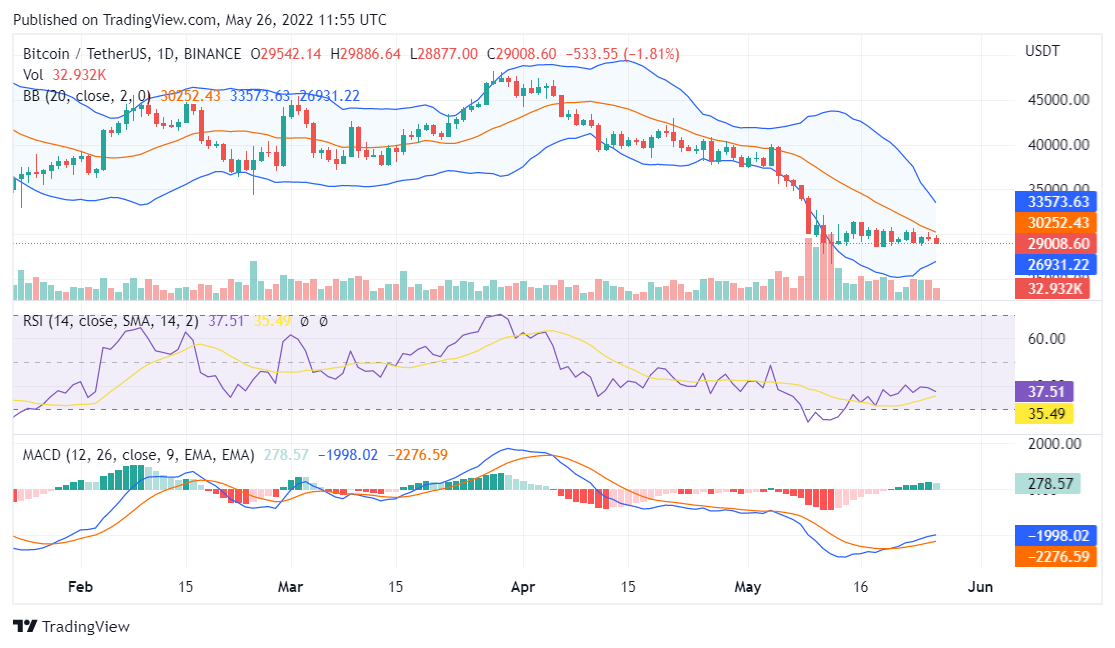
Source: TradingView
The RSI indicator reads a value below 38 which means that the selling pressure for the token is increasing.
The MACD indicator shows that the MACD line remains above the signal line while the bullish intensity of the MACD histogram is declining.
The price action for Bitcoin is situated in the lower end of the Bollinger Bands but is very close to the retest the middle zone of the Bands.
Conclusion
Bitcoin price analysis for May 26, 2022, ends on a bearish note for BTC with significant chances of losing $29000.