

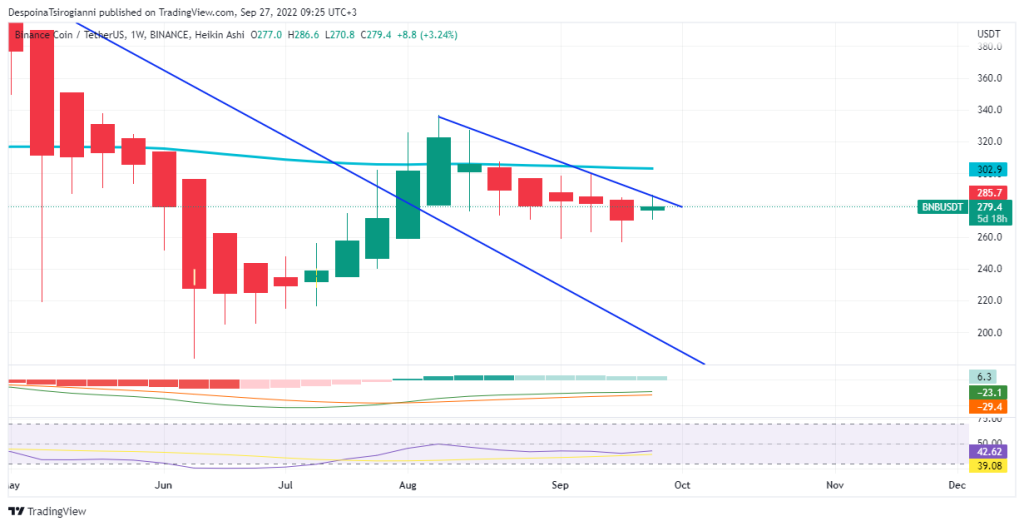
BNB price analysis for 27 September 2022, BNB, the third largest cryptocurrency based on market cap, is in a downtrend since November 2021. The downtrend broke in August but the 50 weekly SMMA stood as resistance. On the second day of this week, it seems that buyers try to take control of the price based on the weekly Heikin Ashi Candlestick. The weekly MACD is negative with a positive histogram and the RSI is still under 50.
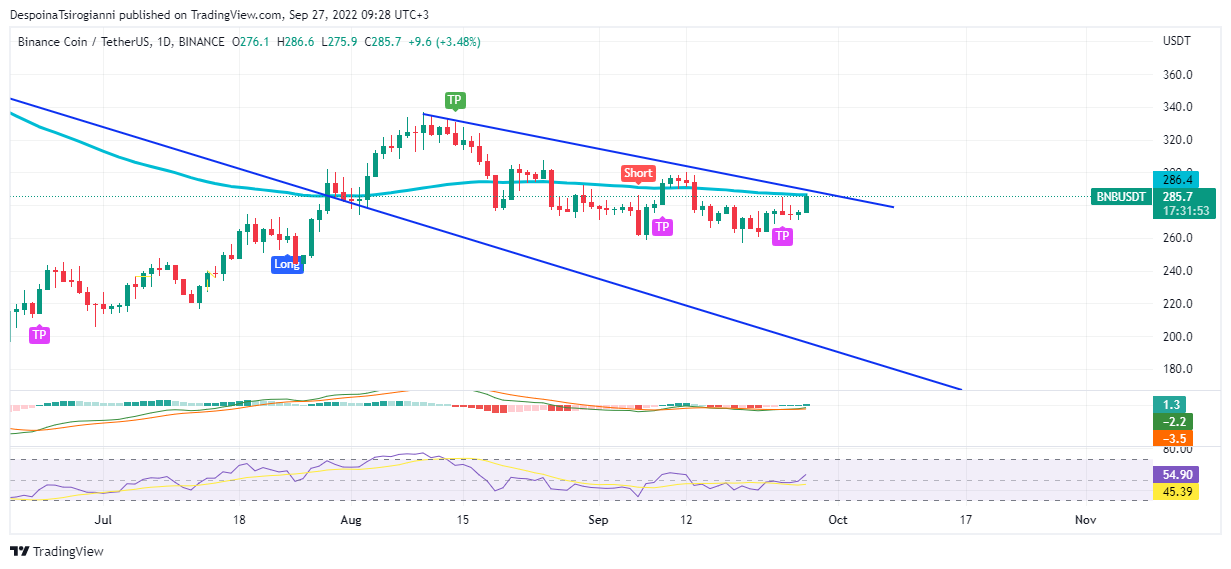
BNB price analysis on the Daily Chart 27 September 2022
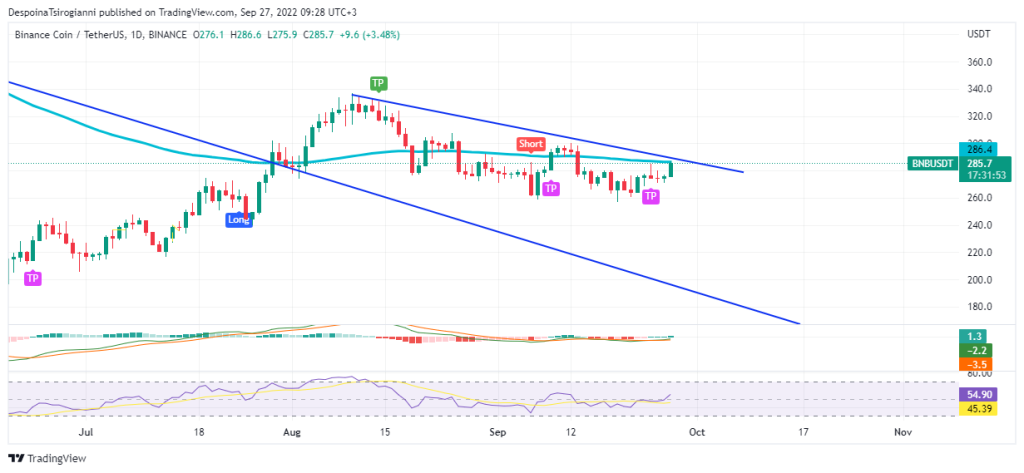
By diving into the daily timeframe, the price fluctuates in a downtrend below the 50 SMMA line ($285.7). Actually, the price forms a retest back on it. Be aware of today’s Jerome Powell speech.
The TFLOW Beta Algo has already generated a Short signal and two TP signals as the buyers keep the price above $260.
The Daily MACD indicator is negative with a positive histogram.
The Daily RSI fluctuates over 50.
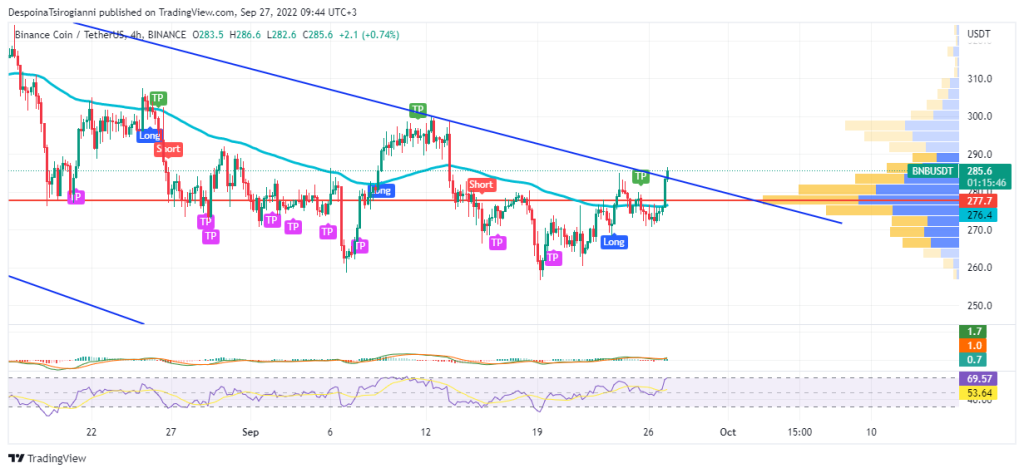
In the 4-hour chart, BNB surpasses the 50 SMMA ($276.4) and tries to cross over the downtrend trendline. The Volume Profile indicator determines $277.4 as a strong trading area which surpassed.
The 4-hour MACD is positive. The 4-hour RSI fluctuates over 50 but is close to the overbought zone.
Conclusion
The price of BNB forms a bearish momentum in a medium-term scale as the technical analysis and the indicators coincide. In the short-term scale, we observe that buyers push the price higher, back to resistance areas. We observe these zones, as dominated by sellers, for a possible upcoming drop.
Read all the latest Crypto Analysis Articles here.
Join the TFLOW Trading Community: https://t.me/tflowglobal
Read More
All News
December 23, 2025

December 23, 2025

December 23, 2025

BlockchainFX is the world’s first crypto exchange connecting traditional finance with blockchain. Join the $BFX presale today and secure your chance for 100x gains!
Join Now