


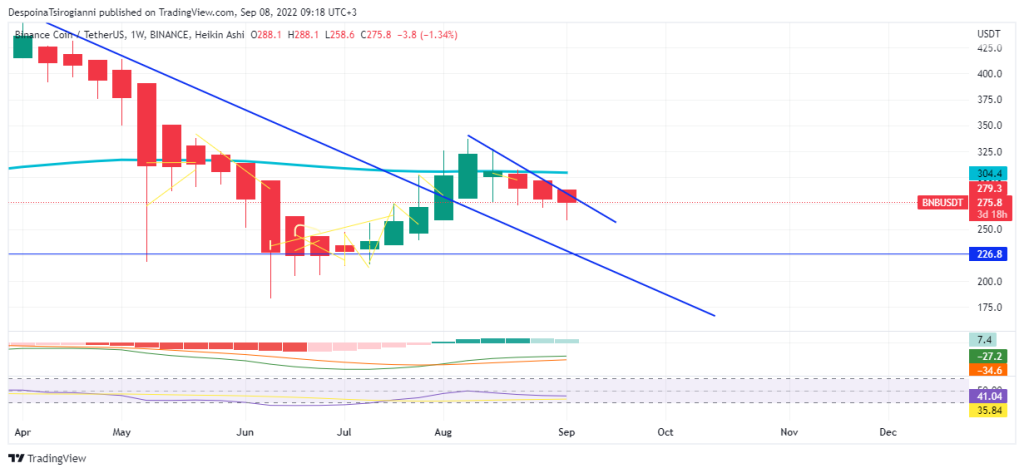
BNB price analysis for 8 September 2022, BNB, the third largest cryptocurrency based on market cap, is in a downtrend since November 2021. The downtrend broke in August but the 50 weekly SMMA stood as resistance. Additionally, this week it seems that BNB is under sellers’ pressure based on the weekly Heikin Ashi Candlestick. The weekly MACD and the RSI are still in negative areas.
BNB price analysis on the Daily Chart 8 September 2022

By diving into the daily timeframe, we identify the price in a downtrend.
The TFLOW Beta Algo has already generated a Short signal.
The Daily MACD indicator fluctuates in negative numbers which indicates bearish pressure.
The Daily RSI fluctuates below 50 which confirms a bearish momentum.
The 50 Daily SMMA stands above the price which means that the bears control the price.
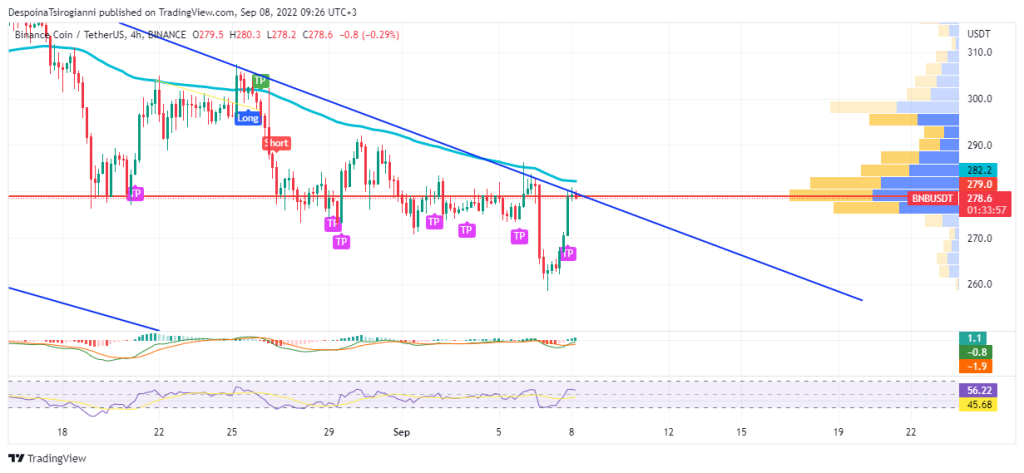
In the 4-hour chart BNB returns back to the 50 SMMA (282.2$) and the Volume Profile indicator area (279$). We determine these areas acted as resistance.
The 4-hour MACD formed a crossover but fluctuates in negative numbers. The 4-hour RSI fluctuates in positive areas over 50.
Conclusion
The price of BNB forms a bearish momentum in medium term scale as the technical analysis and the indicators coincide. In short-term scale, we identify bullish strength as the price fails to drop lower.
Read all the latest Crypto Analysis Articles here.
Join the TFLOW Trading Community: https://t.me/tflowglobal
Read More
All News
December 20, 2025

December 20, 2025

December 20, 2025

BlockchainFX is the world’s first crypto exchange connecting traditional finance with blockchain. Join the $BFX presale today and secure your chance for 100x gains!
Join Now