


The crypto market performance report is back once again to describe to you all the spectacular price action that happened this week. It is important to note that this week was not very bullish or bearish in nature as the entire market seemed to follow a sluggish movement. The chances of all the tokens turning bullish seem quite low as the investors are wondering where the market might be going in the coming days.
The data from CoinMarketCap shows that the market cap of the entire crypto market is currently at $1.8 trillion that is nearly half of what it was in November 2021, when the entire market breached the $3 trillion market cap.
In our crypto market weekly report for this week, we will discuss the following tokens: RAVE, BTC, ETH, SOL, XRP, DOT, LUNA, SAND, DOGE, and SHIB.
Crypto market performance report
In this crypto market weekly performance review, let us have a look at the major cryptocurrencies in the market:
Ravendex (RAVE)
The RAVE token opened the week on a slightly bullish note as we advised holders to keep HODLing in our RAVE analysis for March 14. The $0.004 price level was very strong resistance and remained below this region as noted in our RAVE analysis for March 16.
Finally, RAVE turned bullish and broke above the $0.004 price resistance as noted in RAVE analysis for March 17. However, RAVE was unable to maintain prices above $0.005 and fell back to $0.004.
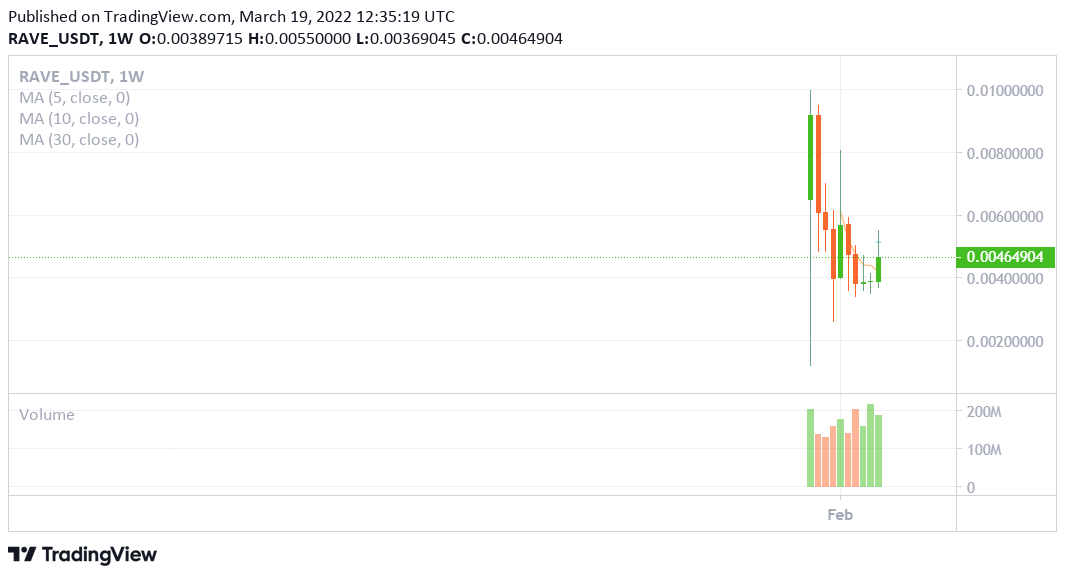
Source: TradingView
Bitcoin (BTC)
Bitcoin opened this week at $38K as the biggest cryptocurrency in the crypto market continued its sideways movement in our BTC analysis for March 15. For March 16, 2022, Bitcoin surged from $37.5K support and broke above $40K in our BTC analysis for March 17. Finally, the token turned sluggish as Bitcoin failed in its attempt to reclaim the $42K price level.
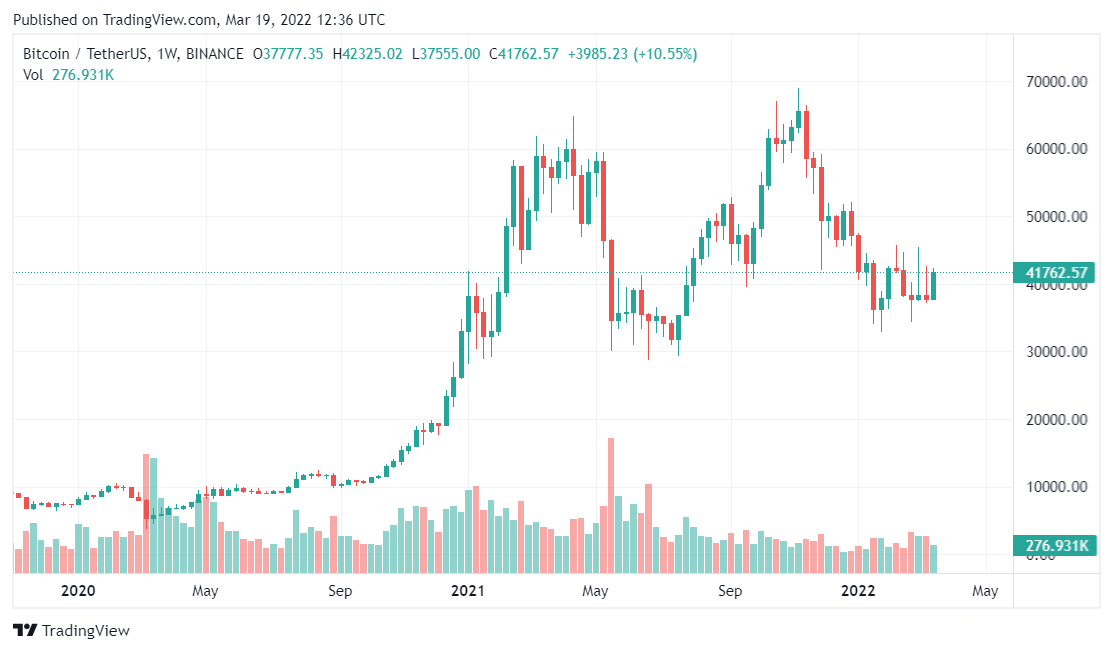
Source: TradingView
Ethereum (ETH)
Ethereum began the week around the $2.5K support and the ETH price analysis for March 15 showed that ETH went as low as it was in June 2021. However, suddenly traders witnessed a huge surge in buying pressure as noted in our ETH price analysis for March 16, and gradually, Ethereum was back above the $2.8K price level. On the other hand, we also noted in our ETH price analysis for March 18 that $2.8K had turned into important support.

Source: TradingView
Solana (SOL)
Solana began the week below the $80 price support and in our SOL price analysis for March 15, we saw that $80 is a very important price level. We noted that SOL lost $80 for a brief moment and then SOL rebounded from the $79 price level swiftly.
As seen in our Solana price analysis for March 17, the token was able to reclaim $90 but the SOL bulls were unable to push SOL above $90.
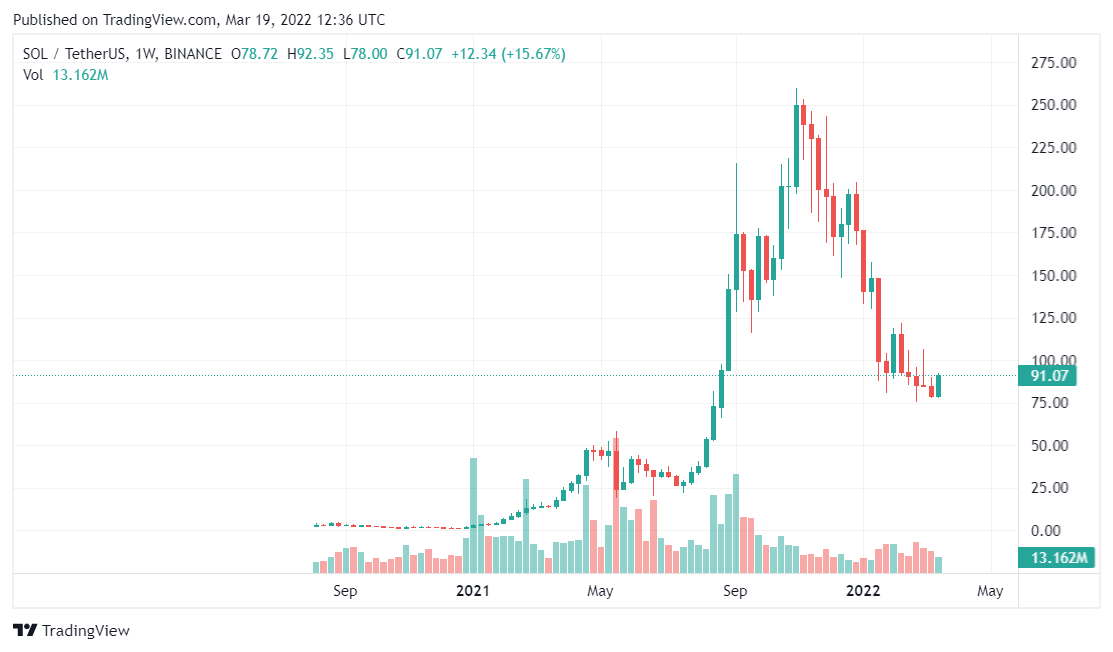
Source: TradingView
Ripple (XRP)
Ripple is one of the most controversial tokens in the crypto market and began the week on a slightly bearish note, as per our XRP analysis for March 14. The XRP token prices reached $0.75 support and the bulls tried to turn this region into support, as per XRP analysis for March 16. Moreover, Ripple found major resistance at $0.8 and XRP remained below $0.8 as noted in our XRP analysis for March 18.
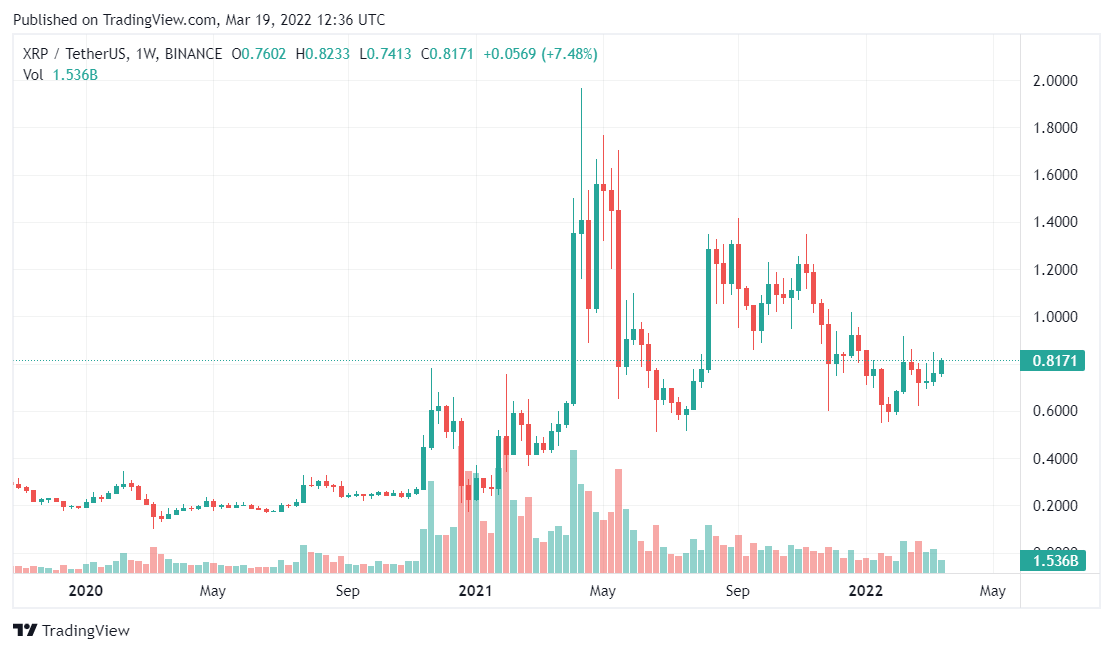
Source: TradingView
Polkadot (DOT)
Polkadot opened the week while failing to breach $19 and we also noted that DOT’s weekly candle was up 5% as of March 15. Moreover, Polkadot jumped 6% as buying pressure surged on March 16.
DOT finally broke above $19 but failed to consolidate. However, our DOT price analysis for March 18 noted that DOT bulls found support at $18.4.
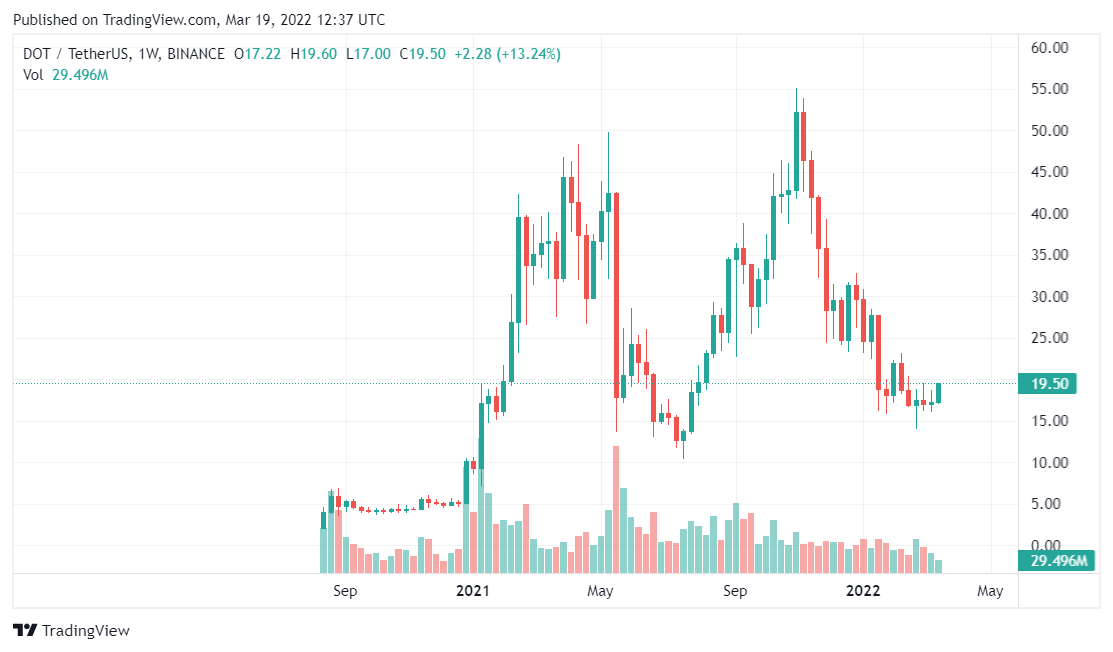
Source: TradingView
Terra (LUNA)
LUNA was one of the most bullish tokens in the crypto market. LUNA opened the week above $90 and found resistance at $95, as noted in LUNA analysis for March 15. Moreover, the LUNA token fell back to $90 support but prices remained above $88, as noted in our LUNA analysis for March 17. The token remained in a cool-off phase as prices dropped to $85, covered in LUNA analysis for March 18.
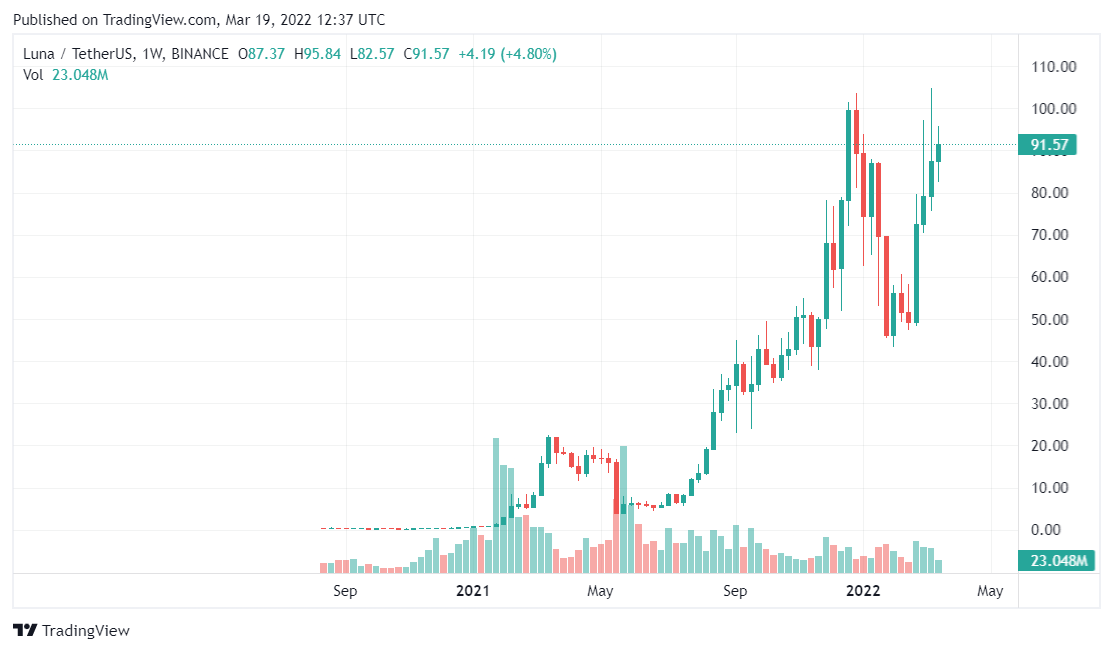
Source: TradingView
The Sandbox (SAND)
SAND opened the week at $2.6 price support and the price trajectory suggested that SAND might drop to the $2.5 price region. However, the token turned bullish as noted in our SAND price analysis for March 16 and investors saw a SAND surge by more than 17% in a single day on March 17th. Finally, the metaverse token was back above $3, as noted by SAND analysis for March 18th.

Source: TradingView
Shiba Inu (SHIB)
Shiba Inu’s performance remained disappointing as SHIB HODLers fought for $0.000020 support. The SHIB token failed to reclaim the $0.000022 price region as this was a major resistance, noted in our SHIB analysis for March 16. However, there was a bullish surge in prices as SHIB was back above $0.000022 but the token once again lost this price level, as noted in our SHIB analysis for March 18.
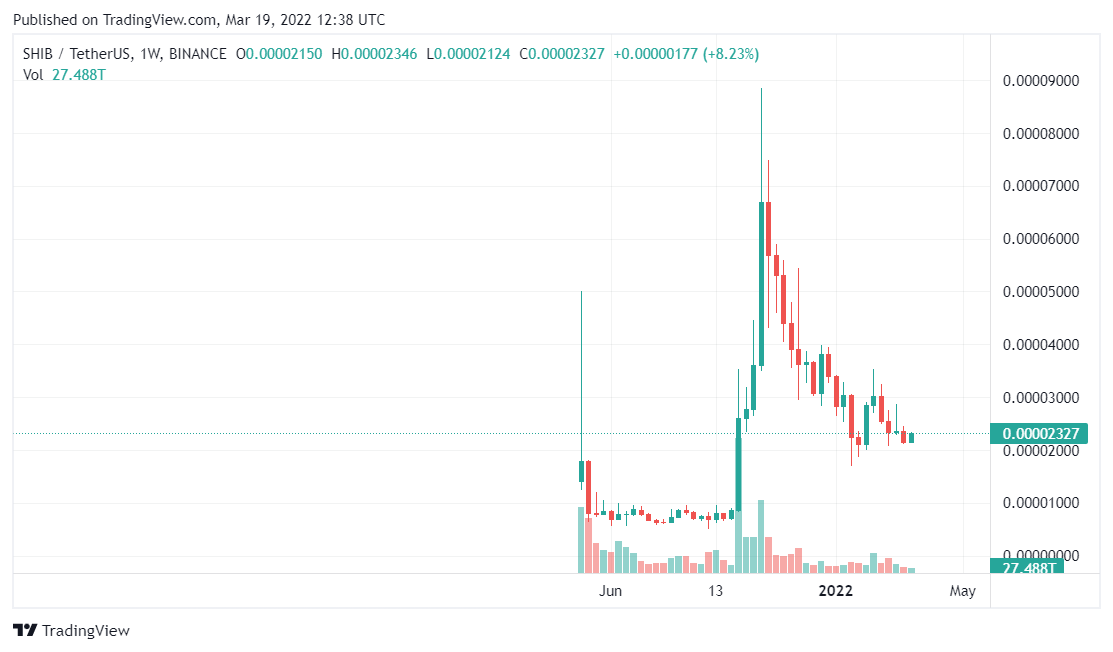
Source: TradingView
Dogecoin (DOGE)
Dogecoin began the weekly candle at the $0.11 price level and remained sluggish, as noted in our DOGE analysis for March 15. However, the meme coin did not fall below $0.11 noted in our DOGE analysis for March 16. TheCoinRise concluded that the chances of losing $0.11 price were pretty high in our DOGE analysis for March 17. It can be said that the right time to invest in DOGE is now, as noted by TheCoinRise in DOGE analysis for March 18.

Source: TradingView
Conclusion
The crypto market weekly report for the week ending March 20 concludes that most of the tokens opened at their respective support and went on to their nearest resistances into support levels. If these levels retain or not, is what investors need to look out for.
Read More
All News
December 19, 2025

December 19, 2025

December 19, 2025

BlockchainFX is the world’s first crypto exchange connecting traditional finance with blockchain. Join the $BFX presale today and secure your chance for 100x gains!
Join Now