Ethereum drops 2% but retains $1100: Should investors get their hopes high?
Ethereum price analysis for July 6, 2022, comes on a bearish note for the world’s 2nd biggest cryptocurrency as we can confirm that the Ether bulls have been chased out of the market in the last 24 hours. The traders are capitalizing on the profits that they have made in the same duration and it seems that investors need to wait and see if ETH is capable of retaining the $1100 price region and making higher highs in the coming days.
As noted in our Ether price analysis for July 5, 2022, there are considerable chances of Ether retesting the $1000 price region as the trading volume for the token remains low and there is no more institutional money going into the market.
The data from CoinMarketCap shows that the trading volume of the coin surged by 18.77% in the last 24 hours, followed by a 2.37% drop in the market cap. Moreover, the Volume / Market Cap has a value of 0.1222, while the Market Dominance dropped to 15.21%.
The daily candle for Ethereum opened at a price of $1132 and reached a daily high of $1155. On the other hand, the daily low for ETH stands at a price of $1111. The price of 1 ETH at the time of writing is $1129.
Ethereum price analysis for July 6 on the daily chart
Ethereum price analysis for July 6, 2022, will take into account the data from the daily chart below and 3 major indicators in the crypto space.
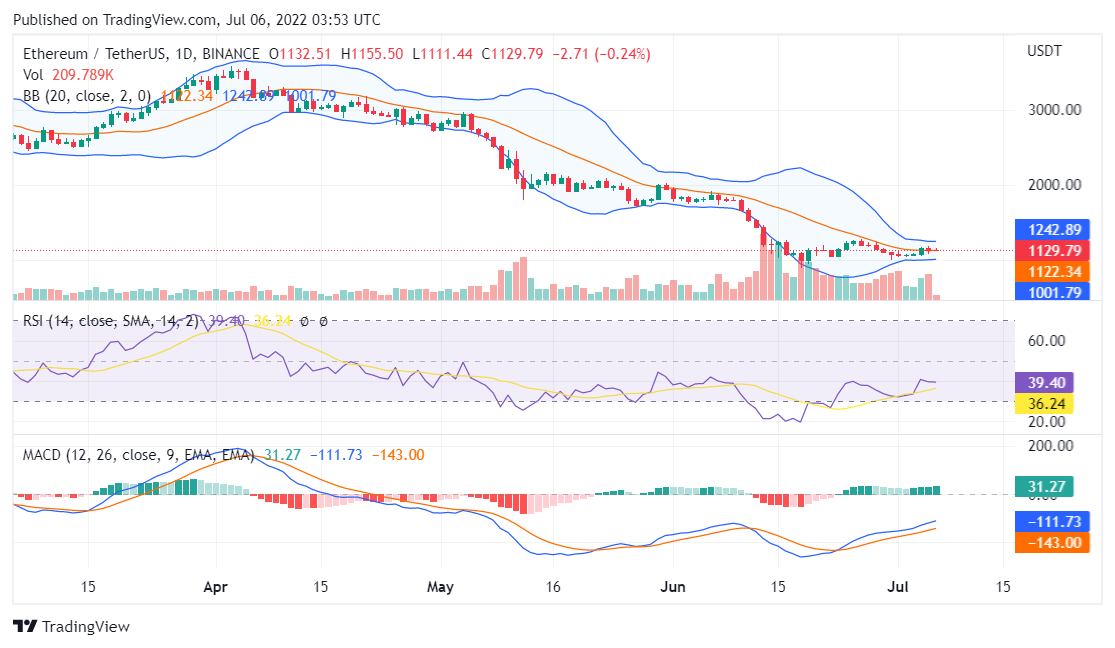
Source: TradingView
The RSI indicator reads a value below 40 confirming that Ethereum bears are overall dominating the price action of the token.
The MACD indicator shows that the MACD line is moving away from the signal line while the histogram remains bullish for Ether.
The price action for Ethereum is retesting the middle region of the Bollinger Bands as investors can expect a breakout into the bearish region.
Conclusion
Ethereum price analysis for July 6, 2022, ends on a bearish note for Ether as it continues to move back and forth between $1K and $1.1K.