Ethereum finally breaks above $1200: Trend reversal might be possible
Ethereum price analysis for July 8, 2022, comes on a bullish note for the world’s 2nd biggest cryptocurrency as the chances of the token making higher highs in the coming days remain considerable. The Ether token rose by nearly 6% in the last 24 hours but it is also an important fact that the token has a major resistance beyond the $1200 price region. It will be interesting to see if ETH is capable of reclaiming the $1500 price level in the coming days which is a major resistance zone to the price action.
As noted in our Ether price analysis for July 7, 2022, there is a very high possibility that the Ether token might aim to retest the $1000 price level before making higher highs if the $1200 price region is not turned into a major support region.
The data from CoinMarketCap shows that the trading volume of the coin surged by 14.28% in the last 24 hours, followed by a 6.59% surge in the market cap. Moreover, the Volume / Market Cap has a value of 0.1042, while the Market Dominance rose to 15.73%.
The daily candle for Ethereum opened at a price of $1237 and reached a daily high of $1276. On the other hand, the daily low for ETH stands at a price of $1231. The price of 1 ETH at the time of writing is $1242.
Ethereum price analysis for July 8 on the daily chart
Ethereum price analysis for July 8, 2022, will take into account the data from the daily chart below and 3 major indicators in the crypto space.
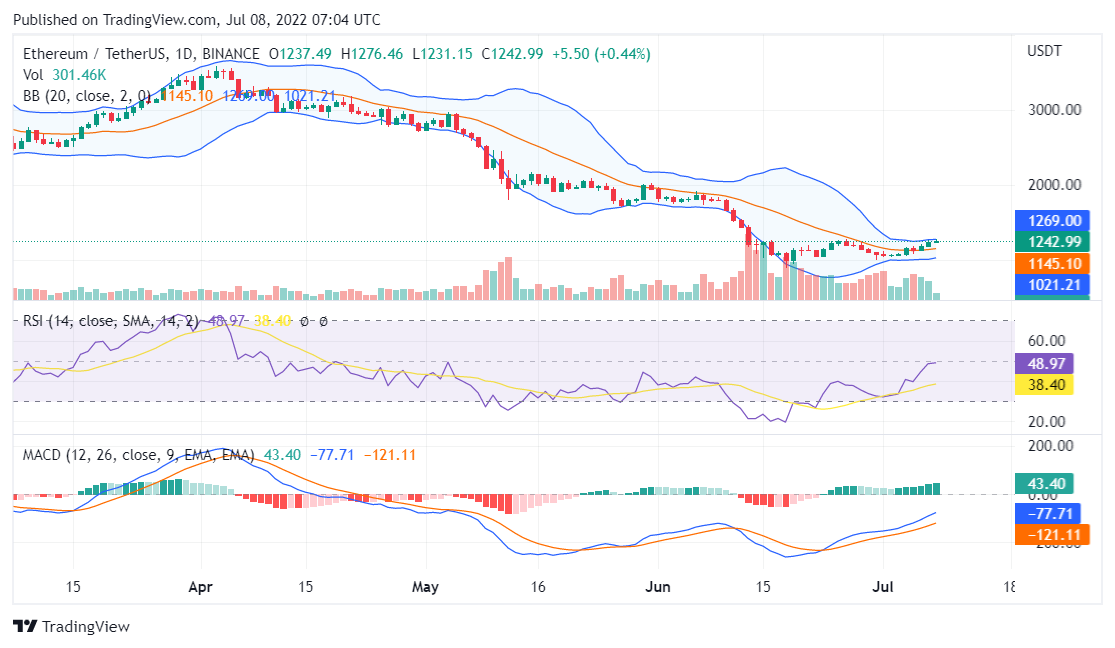
Source: TradingView
The RSI indicator reads a value below 49 which means that bulls are taking over the price action of the Ethereum (ETH) token.
The MACD indicator shows that the MACD line is moving away from the signal line while the MACD histogram remains green.
The price action for Ethereum is retesting the upper region of the Bollinger Bands and a bullish breakout seems likely.
Conclusion
Ethereum price analysis for July 8, 2022, ends on a slightly bullish note for Ether as it aims to turn $1200 into support.