Ethereum price analysis for June 15, 2022, comes on a bearish note for the world’s 2nd biggest cryptocurrency as we have seen a price drop of more than 14% in the last 24 hours. Furthermore, as noted in our Ether price analysis for June 14, 2022, there is a slight support level around the $1000 price region which cannot be expected to hold if the bulls don’t regain control of the price action in the near future. Additionally, we can also confirm that ETH might continue its downtrend if $1000 doesn’t hold.
The data from CoinMarketCap shows that the trading volume of the coin surged by 44.29% in the last 24 hours, followed by a 13.14% drop in the market cap. Moreover, the Volume / Market Cap has a value of 0.1974, while the Market Dominance dropped to 14.78%.
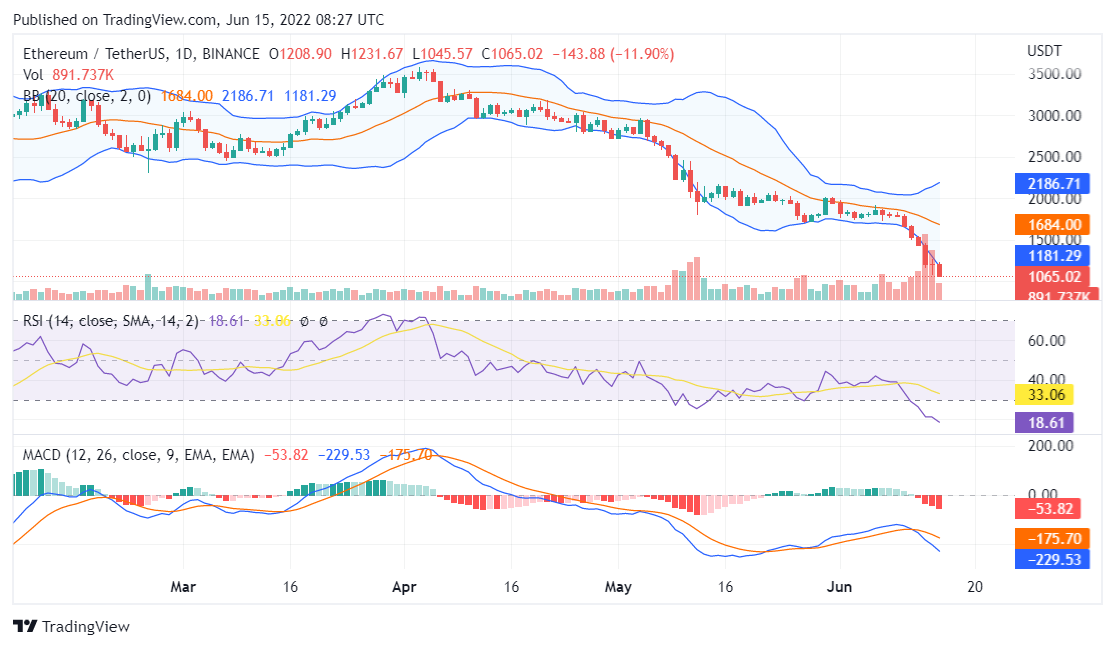
The daily candle for Ethereum opened at a price of $1208 and reached a daily high of $1231.67. On the other hand, the daily low for ETH stands at a price of $1045. The price of 1 ETH at the time of writing is $1065.
Ethereum price analysis for June 15 on the daily chart
Ethereum price analysis for June 15, 2022, will take into account the data from the daily chart below and 3 major indicators in the crypto space.
Source: TradingView
The RSI indicator reads a value below 19 which confirms that Ethereum continues to be oversold in the market and it seems that there are increased chances of lower prices.
The MACD indicator shows that the MACD line remains below the signal line as the MACD histogram turns bearish.
The price action for Ethereum has broken out from the lower end of the Bollinger Bands which means that the bears are very strong.
Conclusion
Ethereum price analysis for June 15, 2022, ends on a bearish note for Ether with increased chances of losing $1000.
$BEAR / Bearly Legal: Elon Musk’s Latest PoE2 Character and the..
BlockchainFX is the world’s first crypto exchange connecting traditional finance with blockchain. Join the $BFX presale today and secure your chance for 100x gains!