

Ethereum price analysis for 12 September 2022, Ethereum, the second largest cryptocurrency based on market cap, is in a downtrend since November 2021. This week, Ethereum is dominated by buyers based on the weekly Doji Heikin Ashi Candlestick. The weekly MACD is still negative but forms a positive histogram. The weekly RSI fluctuates below 50, and the price is still under the 50 SMMA line.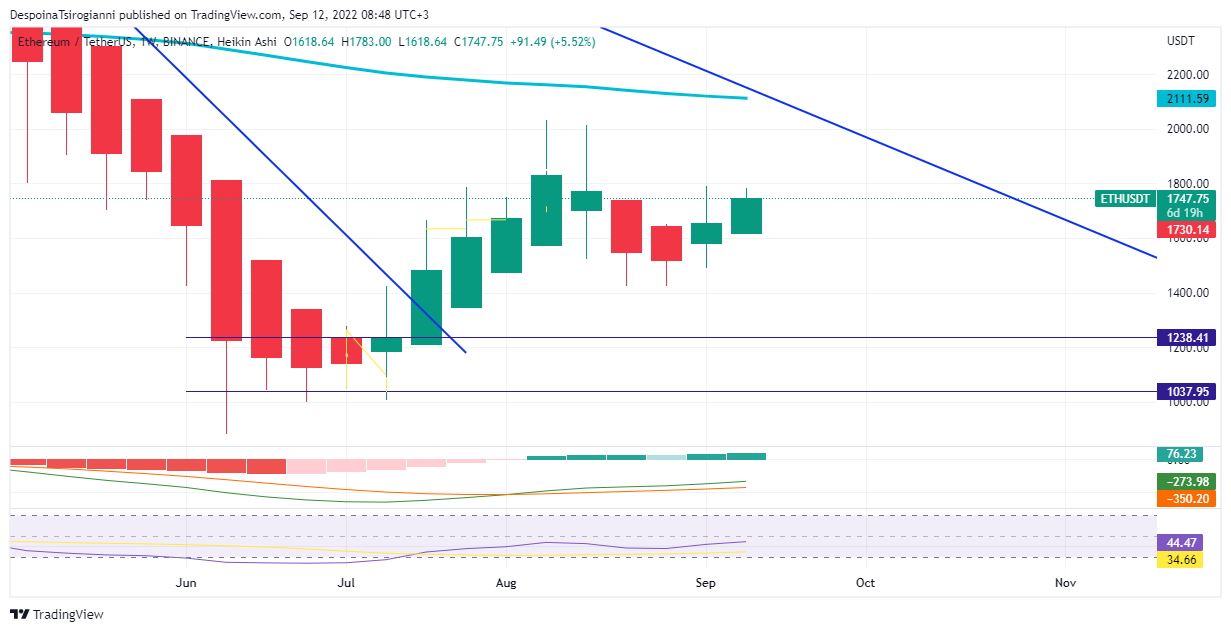
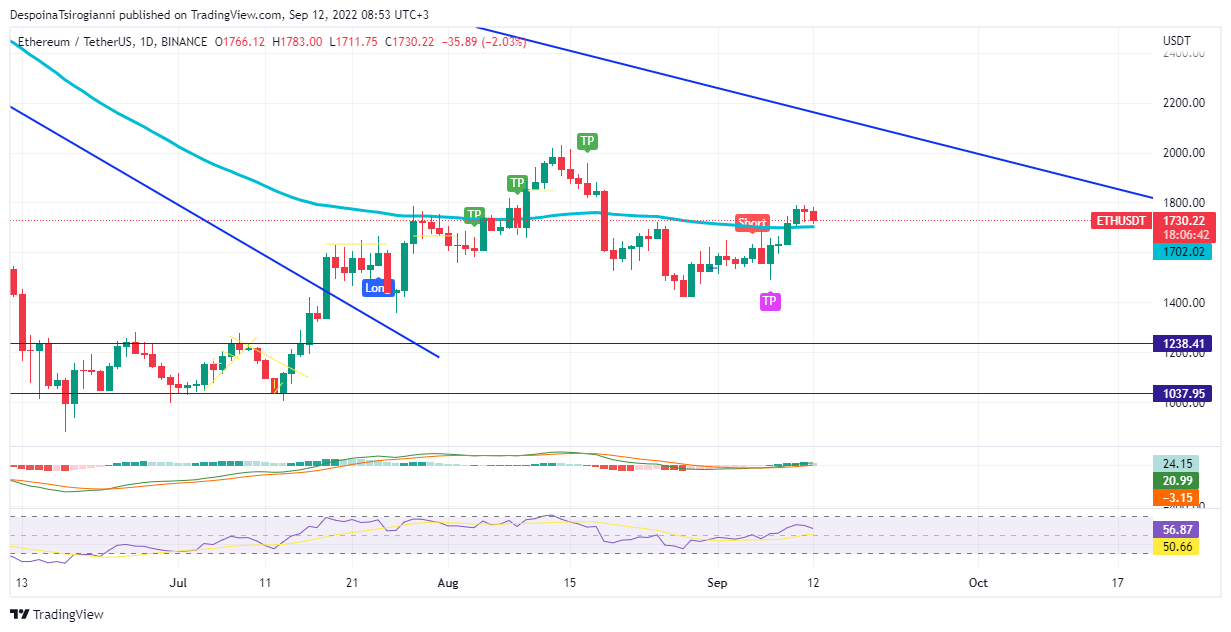
Ethereum price analysis on the Daily Chart for 12 September 2022
By diving into the daily timeframe, we identify that the buyers push the price over the 50 SMMA line. Now the price is forming a retest back to the 50 SMMA line which tries to turn into support.
The TFLOW Beta Algo has already generated a Short signal and a TP signal, as buyers push the price higher.
The Daily MACD indicator tries to turn positive.
The Daily RSI fluctuates over 50 which confirms a bullish momentum but seems a little bit exhausted.
 In the 4-hour chart, Ethereum forms an uptrend and the price fluctuates over the 50 SMMA ($1645.544) and the Volume Profile indicator area ($1567.20).
The 4-hour MACD line and the signal line are positive, but a negative histogram is forming. The 4-hour RSI still fluctuates over 50.
Conclusion
The price of Ethereum tries to reverse the bearish dominance in a medium-term scale with the daily timeframe being the most crucial. In a short-term scale, buyers take the control of the price as the indicators are still positive, but a bearish momentum is very likely to appear.
Read all the latest Crypto Analysis Articles here.
Join the TFLOW Trading Community: https://t.me/tflowglobal
Read More
All News
December 24, 2025

December 24, 2025

December 24, 2025

BlockchainFX is the world’s first crypto exchange connecting traditional finance with blockchain. Join the $BFX presale today and secure your chance for 100x gains!
Join Now