

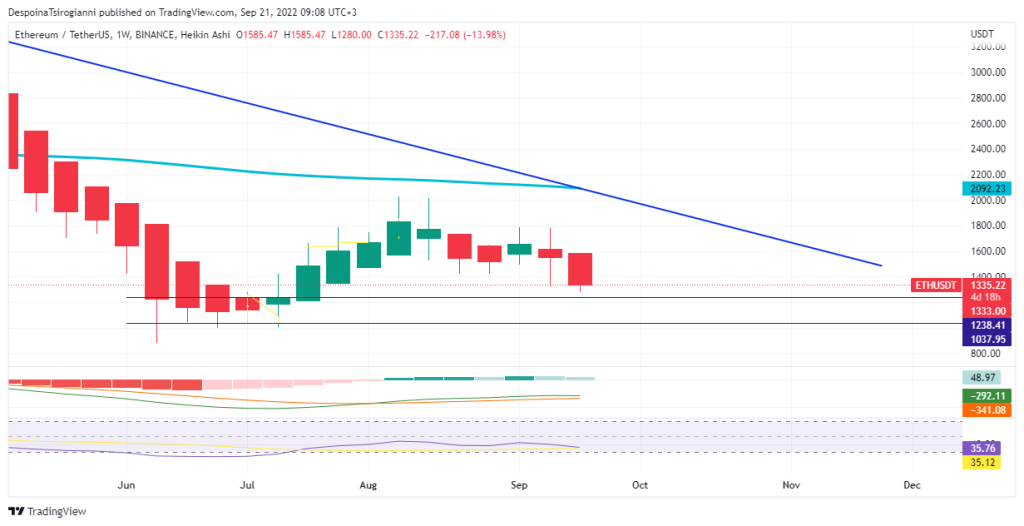
Ethereum price analysis for 21 September 2022, Ethereum, the second largest cryptocurrency based on market cap, is in a downtrend since November 2021. On the third day of this week, it seems that sellers take control of the price based on the weekly Heikin Ashi Candlestick. The weekly MACD is still negative but forms a positive histogram. The weekly RSI fluctuates below 50, and the price is still under the 50 SMMA line.
 Ethereum price analysis on the Daily Chart for 21 September 2022
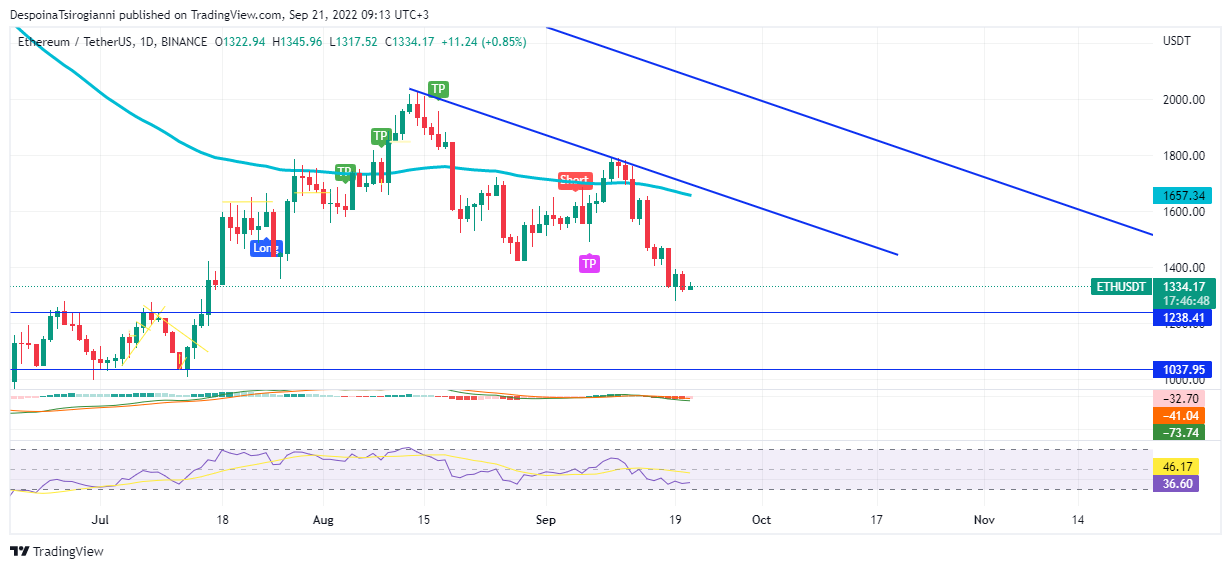
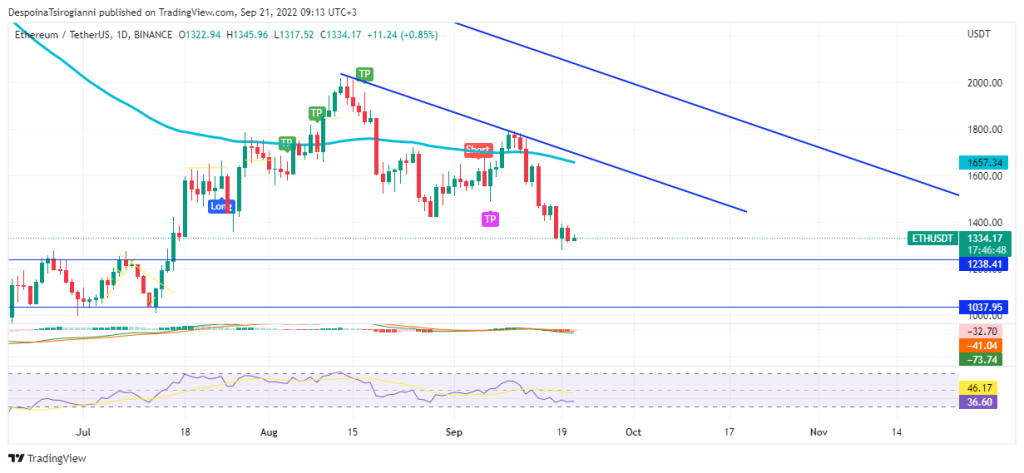 By diving into the daily timeframe, we identify that the sellers push the price lower close to $1238.41. Also the price fluctuates below the 50 SMMA line. Be aware of today’s FOMC statement, as volatility is expected in the market.
The TFLOW Beta Algo has already generated a Short signal and a TP signal, as buyers pushed the price higher.
The Daily MACD indicator turns negative.
The Daily RSI fluctuates under 50 which confirms a bearish momentum.
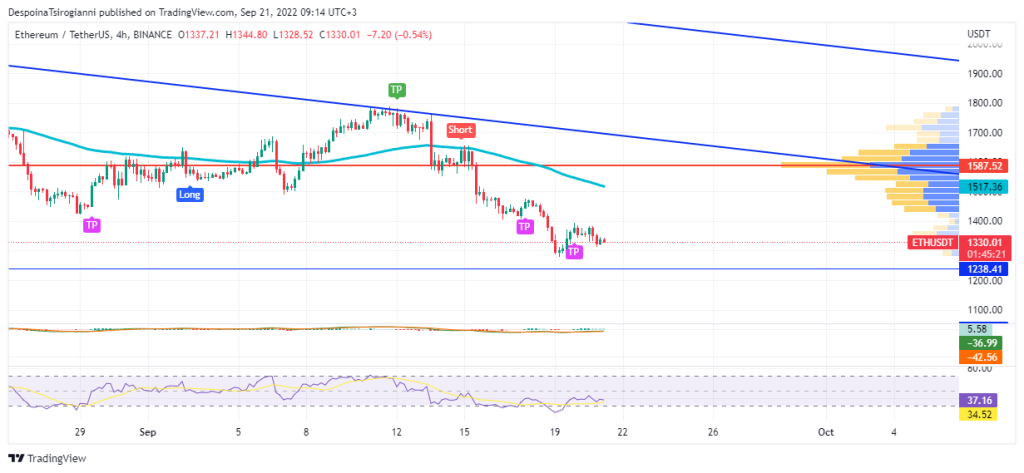 In the 4-hour chart, Ethereum forms a downtrend and fluctuates below the 50 SMMA ($1539.41). The Volume Profile indicator determines $1593.73 as a strong trading area. A retest back to the SMMA or Volume Profile is very likely.
The 4-hour MACD is negative but forms a positive histogram. The 4-hour RSI fluctuates under 50 and seems that returns back from the overbought zone.
Conclusion
The price of Ethereum continues in a downtrend in a medium-term scale, as sellers push the price lower. In a short-term scale, we observe that buyers try to control the price, but no strong upward movement has taken place yet.
Read all the latest Crypto Analysis Articles here.
Join the TFLOW Trading Community: https://t.me/tflowglobal
Read More
All News
January 13, 2026

January 13, 2026

January 13, 2026

BlockchainFX is the world’s first crypto exchange connecting traditional finance with blockchain. Join the $BFX presale today and secure your chance for 100x gains!
Join Now