

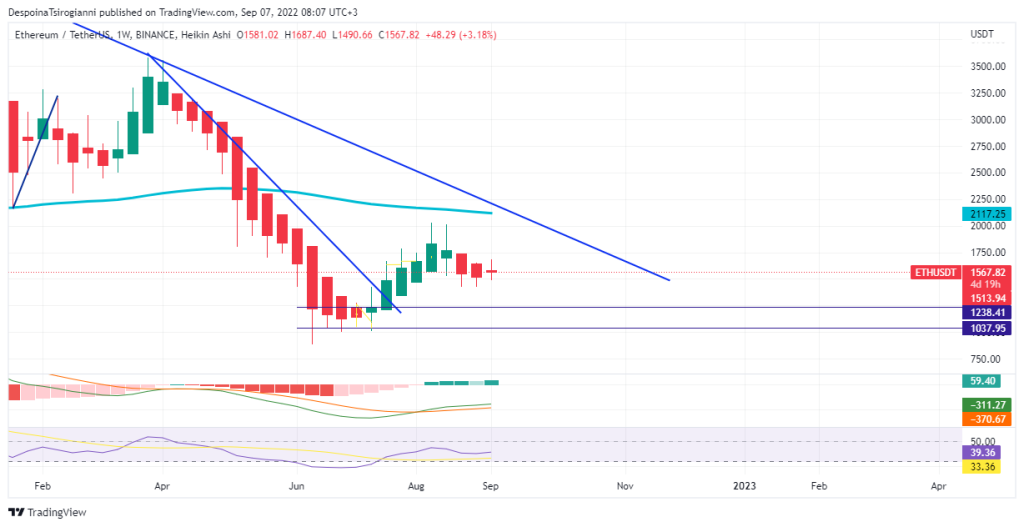
Ethereum price analysis for 7 September 2022, Ethereum the second largest cryptocurrency based on market cap, is in a downtrend since November 2021. On the third day of the week, Ethereum is dominated by sellers based on the weekly Doji Heikin Ashi Candlestick. The weekly MACD is still negative but forms a positive histogram. The weekly RSI fluctuates below 50, and the price is still under the 50 SMMA line.
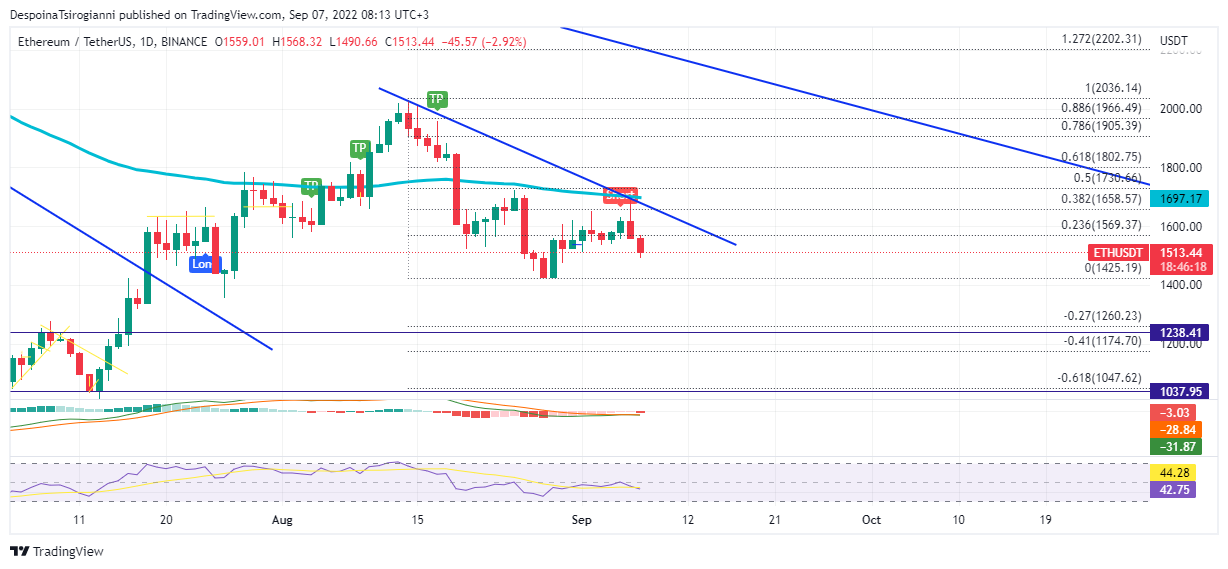
Ethereum price analysis on the Daily Chart for 7 September 2022

By diving into the daily timeframe, we identify bearish price action in continuation, as the price forms Lower Highs and Lower Lows. Also, Ethereum has retested the 0.382 level of the bearish Fibonacci.
The TFLOW Beta Algo has already generated a Short signal.
The Daily MACD indicator fluctuates in negative numbers which indicates a bearish pressure.
The Daily RSI eventually fluctuates under 50 which confirms a bearish momentum.
The 50 Daily SMMA stood above the price as a resistance which means that the bears control the price at the moment.

In the 4-hour chart, Ethereum broke the previous uptrend and fell under the 50 SMMA. The Volume Profile indicator identifies 1586.73$ as a strong trading area.
The 4-hour MACD turns slightly negative and the 4-hour RSI fluctuates under 50.
Conclusion
The price of Ethereum is under a bearish dominance in a medium-term scale as the technical analysis and the indicators determine a bearish momentum. In a short-term scale, sellers take control of the price as the indicators turn negative.
Read all the latest Crypto Analysis Articles here.
Join the TFLOW Trading Community: https://t.me/tflowglobal
Read More
All News
December 22, 2025

December 22, 2025

December 22, 2025

BlockchainFX is the world’s first crypto exchange connecting traditional finance with blockchain. Join the $BFX presale today and secure your chance for 100x gains!
Join Now