


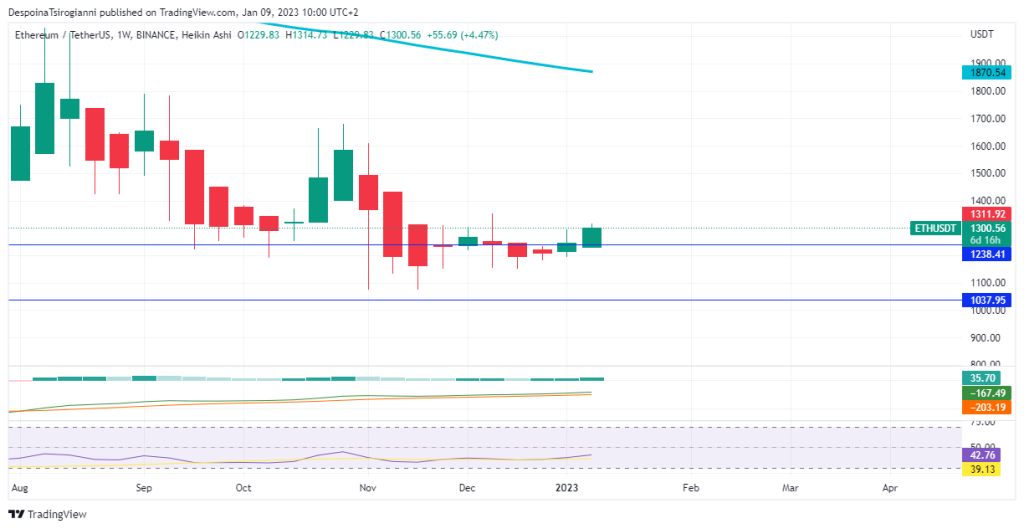
Ethereum price analysis for 9 January 2023, Ethereum, the second-largest cryptocurrency based on market cap, is in a downtrend since November 2021. You can read more about Ethereum price from CoinCodex. On the first day of this week, it seems that buyers try to control the price based on the weekly Heikin Ashi Candlestick. The weekly MACD is still negative but forms a positive histogram. The weekly RSI fluctuates below 50, and the price is still under the 50 SMMA line.
Ethereum price analysis on the Daily Chart for 9 January 2023
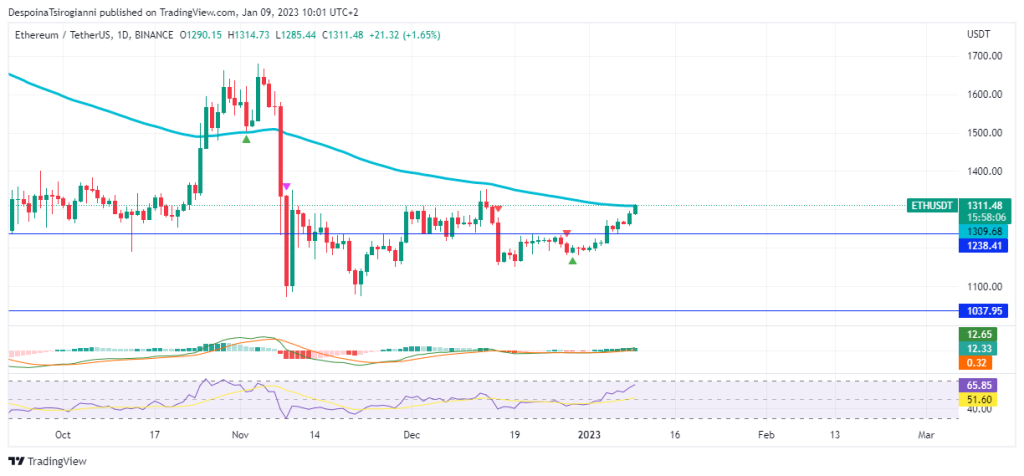
By diving into the daily timeframe, we identify that the price surpassed the $1238.41 zone. The price reaches the 50 SMMA ($1309.68) and we observe this area for price reaction.
The TFLOW V2 Algo has generated a Long signal.
The Daily MACD is positive.
The Daily RSI fluctuates over 50.
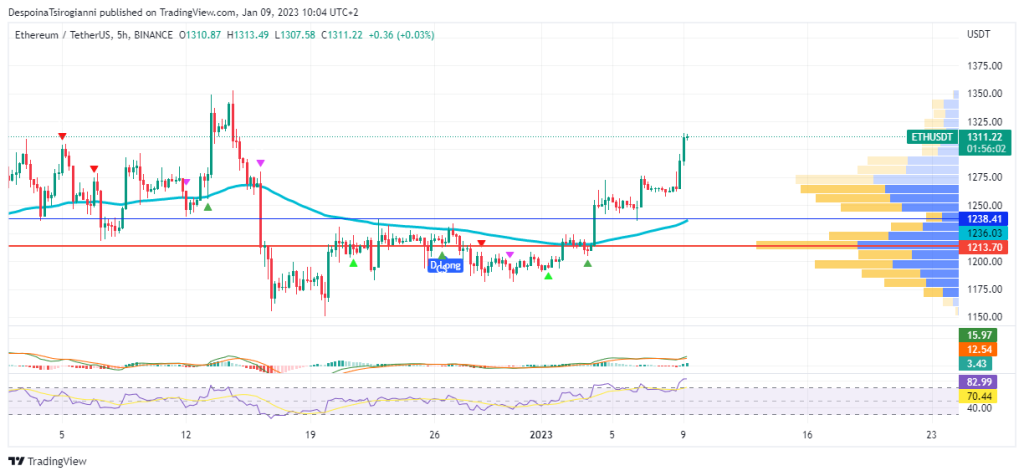
In the 5-hour chart, Ethereum fluctuates over the 50 SMMA line ($1236.03). Moreover, the Volume Profile indicator determines $1213.70 as a strong trading area that has surpassed too. The price reaches previous highs.
The 5-hour MACD is positive. Additionally, the 5-hour RSI fluctuates over 50 and close to the overbought zone.
Conclusion
The price of Ethereum continues in a downtrend in the medium-term scale, as the technical analysis and indicators coincide. In a short-term scale, the price forms an uptrend movement close to previous resistance zones. A price decrease could happen at these areas.
Read all the latest Crypto Analysis Articles here.
Join the TFLOW Trading Community: https://t.me/tflowglobal
Read More
All News
December 23, 2025

December 23, 2025

December 23, 2025

BlockchainFX is the world’s first crypto exchange connecting traditional finance with blockchain. Join the $BFX presale today and secure your chance for 100x gains!
Join Now