Shiba Inu continues downtrend: What to expect?
Shiba Inu price analysis for May 27, 2022, comes on a bearish note as we have seen the token lose 10% of its price in the last 24 hours. It seems that the chances of breaking higher are not very high as we might see SHIB lose the $0.000010 price support which was retested earlier. As noted in our SHIB price analysis for May 26, 2022, the meme coin has a major resistance zone beyond the $0.000013 price region which hasn’t been broken in the last few days. It seems that there is a major possibility of losing $0.000010.
The data from CoinMarketCap shows that the trading volume for SHIB has jumped 99.66% in the last 24 hours, while the market cap of the token has dropped by 10.11% in the same duration. Moreover, the Volume / Market Cap Ratio stands at a value of 0.09182, while the Market Dominance of the token dropped to 0.48%.
The daily candle for Shiba Inu opened at a price of $0.00001059 and reached a daily high of $0.00001070. Moreover, the daily low for the token stands at a price of $0.00001012. The price of 1 SHIB at the time of writing is $0.00001036.
Shiba Inu price analysis on the daily chart for May 27
Shiba Inu price analysis for May 27 will take into consideration the data from the indicators integrated into the daily chart below.
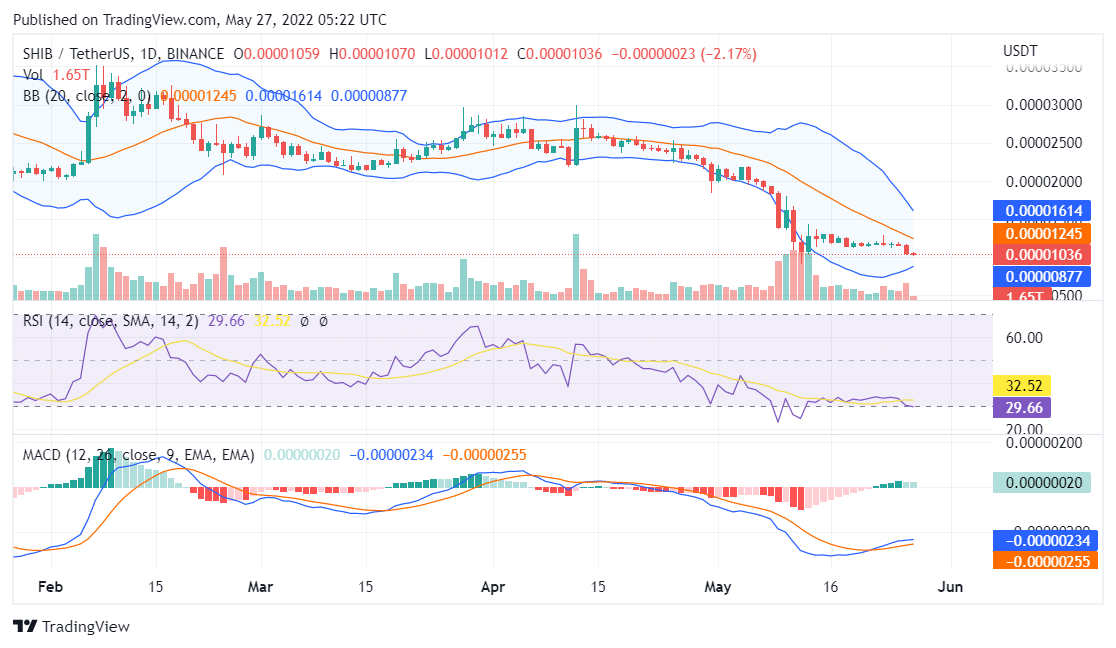
Source: TradingView
The RSI indicator reads a value below 30 which means that the bears are dominating the price action of Shiba Inu.
The MACD indicator shows that the MACD line remains above the signal line but the two lines are very close to each other and a bearish divergence might follow.
The Shiba Inu price action is situated in the bearish zone of the Bollinger Bands as the chances of breaking out of the lower end of the Bands are getting higher.
Conclusion
Shiba Inu price analysis for May 27, 2022, ends on a bearish note for the meme coin with high chances of losing $0.000010.