Shiba Inu continues to underperform: Buy or pass?
Shiba Inu price analysis for June 17, 2022, comes on a bearish note for the meme coin as the coin continues to underperform when compared to its rival meme coin which has now reclaimed the 10th position in the crypto market after losing it briefly in the last 24 hours, as per DOGE price analysis for June 17, 2022. Additionally, as noted in our SHIB price analysis for June 16, 2022, the token tried to beach the $0.000009 price region but failed to do so, dropping to the 17th position in the crypto market as a result.
The data from CoinMarketCap shows that the trading volume for SHIB has dropped by 35.29% in the last 24 hours, while the market cap of the token has risen by 0.55% in the same duration. Moreover, the Volume / Market Cap Ratio stands at a value of 0.0649, while the Market Dominance of the token rests at 0.50%.
The daily candle for Shiba Inu opened at a price of $0.00000798 and reached a daily high of $0.00000833. Moreover, the daily low for the token stands at a price of $0.00000794. The price of 1 SHIB at the time of writing is $0.00000810.
Shiba Inu price analysis on the daily chart for June 17
Shiba Inu price analysis for June 17, 2022, will take into consideration the data from the indicators integrated into the daily chart below.
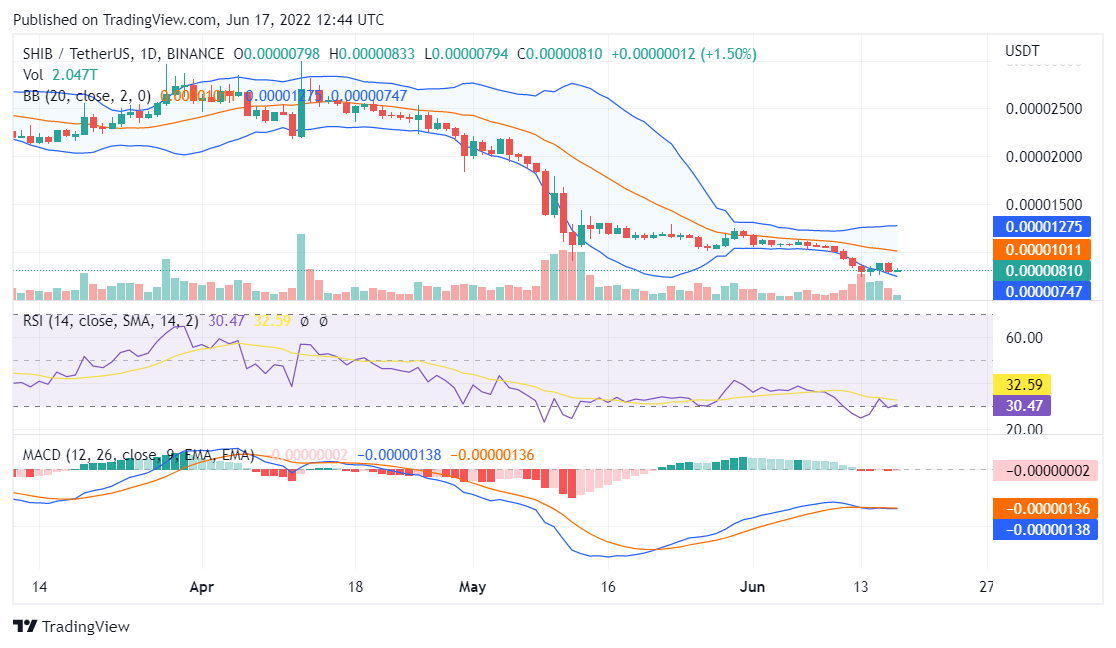
Source: TradingView
The RSI indicator reads a value below 31 which confirms that bears are overall in charge of the Shiba Inu price action.
The MACD indicator shows that the MACD line continues to touch the signal line and there are increased chances of a bearish divergence.
The Shiba Inu price action aims to break out from the lower end of the Bollinger Bands soon.
Conclusion
Shiba Inu price analysis for June 17, 2022, ends on a bearish note for the SHIB token with low chances of holding above the $0.000008 price region.