Shiba Inu drops 4% as indicators turn bearish: Key points to note
Shiba Inu price analysis for June 23, 2022, comes on a bearish note for the token with considerable chances of losing the $0.000010 price region if the bulls don’t take over the price action in the near future. Furthermore, as noted in our SHIB price analysis for June 22, 2022, the meme coin has strong support toward the $0.000010 price level. In the past, we have witnessed the meme coin able to retain its 17th position in the market and the meme coin went on to reclaim the 14th position in the market. However, as of now, it is ranked 15th in the market.
The data from CoinMarketCap shows that the trading volume for SHIB has dropped by 52.25% in the last 24 hours, while the market cap of the token has dropped by 3.94% in the same duration. Moreover, the Volume / Market Cap Ratio stands at a value of 0.1624, while the Market Dominance of the token rest at 0.61%.
The daily candle for Shiba Inu opened at a price of $0.00000968 and reached a daily high of $0.00001045. Moreover, the daily low for the token stands at a price of $0.00000961. The price of 1 SHIB at the time of writing is $0.00001013.
Shiba Inu price analysis on the daily chart for June 23
Shiba Inu price analysis for June 23, 2022, will take into consideration the data from the indicators integrated into the daily chart below.
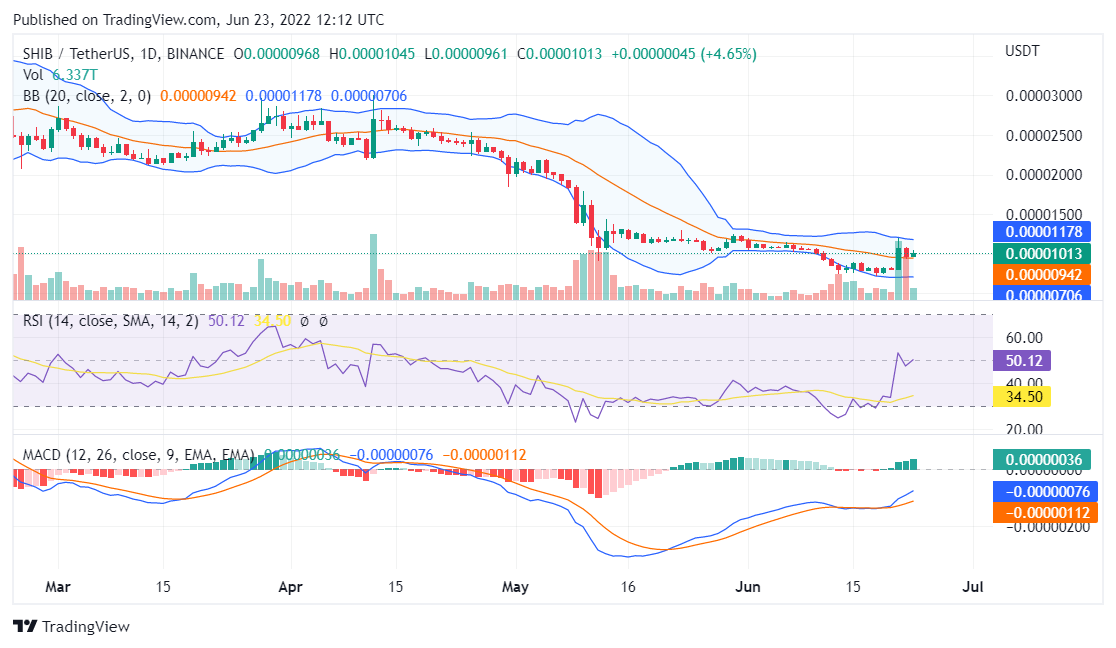
Source: TradingView
The RSI indicator reads a value below 51 which means that the bulls and the bears are fighting for dominance.
The MACD indicator shows that the MACD line remains above the signal line while the histogram remains bullish for the meme coin.
The Shiba Inu price action has broken into the bullish zone of the Bollinger Bands but a retest of the Middle zone seems likely.
Conclusion
Shiba Inu price analysis for June 23, 2022, ends on a bearish note for the SHIB token with considerable chances of losing $0.000010.