Shiba Inu falls to 17th position in the market despite reclaiming $0.000008
Shiba Inu price analysis for June 20, 2022, comes on a bearish note for the meme coin as we can see that the token has successfully breached the $0.000008 price region in the last 24 hours. The prices surged by more than 4% in the last 24 hours as bulls were back in action. However, the SHIB token fell to the 17th position in the crypto space despite the 4% price rise. As noted in our SHIB price analysis for June 19, 2022, the token has a major resistance toward the $0.000010 price region which needs to be flipped into support.
The data from CoinMarketCap shows that the trading volume for SHIB has dropped by 9.56% in the last 24 hours, while the market cap of the token has surged by 4.02% in the same duration. Moreover, the Volume / Market Cap Ratio stands at a value of 0.06535, while the Market Dominance of the token dropped to 0.50%.
The daily candle for Shiba Inu opened at a price of $0.00000822 and reached a daily high of $0.000008347. Moreover, the daily low for the token stands at a price of $0.00000788. The price of 1 SHIB at the time of writing is $0.00000823.
Shiba Inu price analysis on the daily chart for June 20
Shiba Inu price analysis for June 20, 2022, will take into consideration the data from the indicators integrated into the daily chart below.
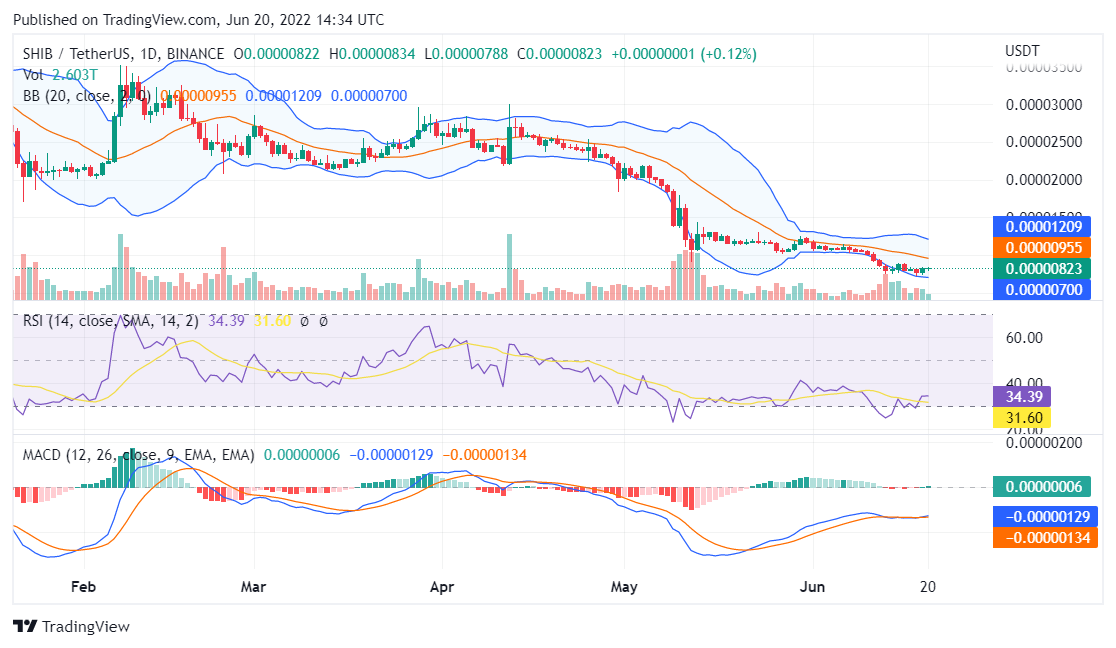
Source: TradingView
The RSI indicator reads a value below 35 which means that the price action is dominated by the bears overall and investors can expect another drop in the near future.
The MACD indicator shows that the MACD line is touching the signal line which indicates that the trading volume of Shiba Inu is very low.
The Shiba Inu price action aims to retest the middle zone of the Bollinger Bands which confirms that SHIB still has potential.
Conclusion
Shiba Inu price analysis for June 20, 2022, ends on a bullish note for the SHIB token with high chances of holding above $0.000008.