Shiba Inu loses 16th position in the market: What to expect?
Shiba Inu price analysis for June 12, 2022, comes on a bearish note for the meme coin as the chances of the token reclaiming the $0.000010 price region seem quite low. In the last 24 hours, we have seen the meme coin drop 13.63% and it seems that we can expect lower prices as well. As noted in our SHIB price analysis for June 11, 2022, the meme coin has lost the 16th position in the market and it seems that the public interest in the SHIB token is declining.
The data from CoinMarketCap shows that the trading volume for SHIB has surged by 73.23% in the last 24 hours, while the market cap of the token has dropped by 13.38% in the same duration. Moreover, the Volume / Market Cap Ratio stands at a value of 0.08189, while the Market Dominance of the token dropped to 0.44%.
The daily candle for Shiba Inu opened at a price of $0.00000936 and reached a daily high of $0.00000942. Moreover, the daily low for the token stands at a price of $0.00000864. The price of 1 SHIB at the time of writing is $0.00000879.
Shiba Inu price analysis on the daily chart for June 12
Shiba Inu price analysis for June 12, 2022, will take into consideration the data from the indicators integrated into the daily chart below.
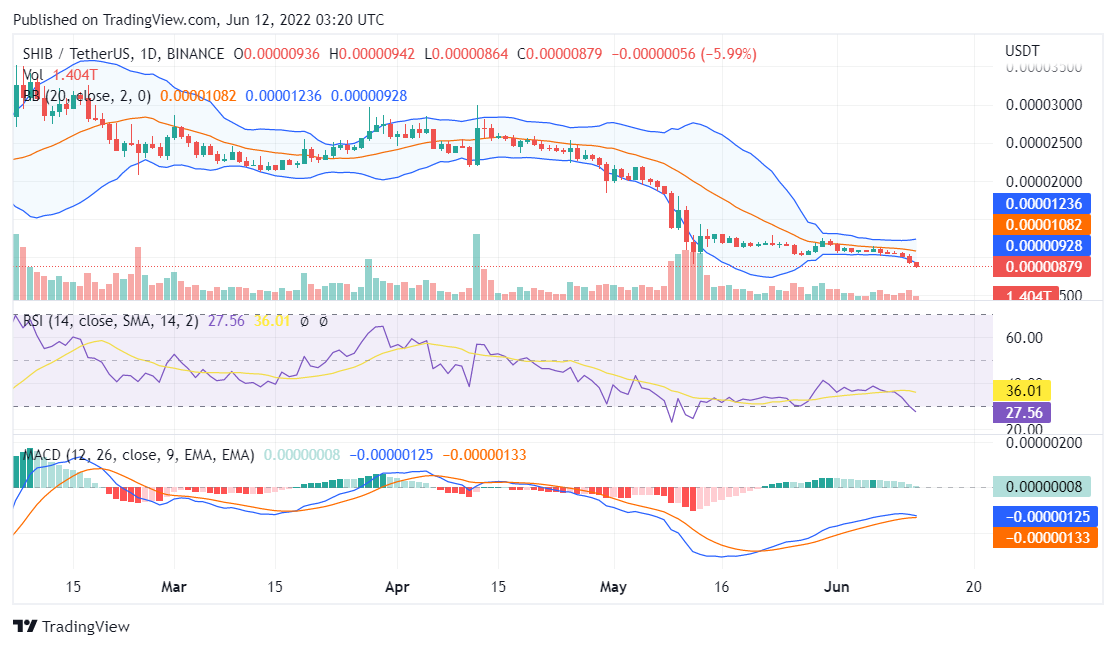
Source: TradingView
The RSI indicator reads a value below 28 which confirms that the selling pressure is considerably high while the gradient of the line suggests that SHIB is being oversold.
The MACD indicator shows that the MACD line is touching the signal line as a bearish divergence for the token can be confirmed.
The Shiba Inu price action is situated in the bearish region of the Bollinger Bands and a bearish breakout can also be seen.
Conclusion
Shiba Inu price analysis for June 12, 2022, comes on a bearish note for the meme coin as the token might lose $0.000008.