Solana loses $40 once again after network outage
Solana price analysis for June 2, 2022, comes on a bearish note for the SOL coin as we have seen the token lose the $40 price support and it seems that we might see the token in the lower $30s as well. Furthermore, as noted in our SOL price analysis for June 1, 2022, the token has major resistance beyond the $50 price level which was previously a major support region for the token. We have also seen that SOL has dropped nearly 85% from its all-time high noted on Nov 06, 2021, at a price of $260.
The data from CoinMarketCap shows that the trading volume for SOL surged by 28.40% in the last 24 hours, followed by an 11.37% drop in the market cap. The Market Dominance of the Solana token dropped to 1.09%, while the Volume / Market Cap Ratio stands at 0.1209.
The daily candle for Solana was initiated at a price of $40.11 and reached a daily high of $40.24. Furthermore, the daily low for SOL was seen at $38.13, while the price of 1 SOL at the time of writing was $39.71.
Solana price analysis from the daily chart for June 2
Solana price analysis for June 2, 2022, will take into account the data from the daily chart below and 3 major indicators integrated into it.
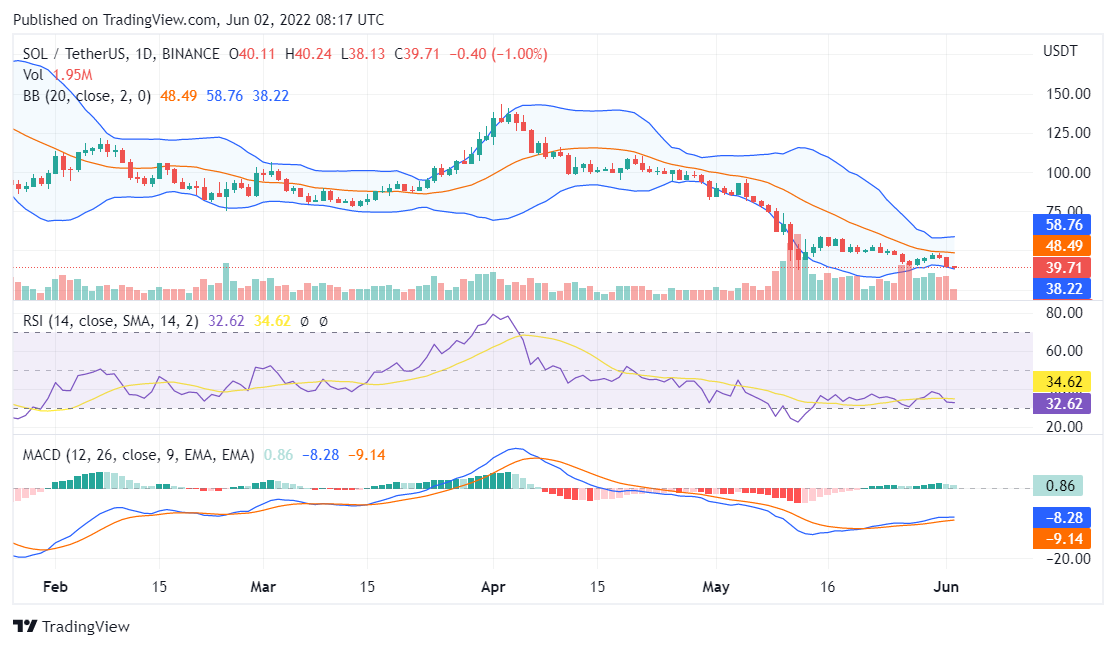
Source: TradingView
The MACD indicator shows that the MACD line is above the signal line while the intensity of the MACD histogram continues to decrease.
The RSI indicator reads a value below 33 which confirms that bears have regained control of the price action and the gradient of the line confirms that lower prices will be seen.
The price action for Solana is situated at the lower end of the Bollinger Bands and a bearish breakout of prices is certainly possible.
Conclusion
Solana price analysis for June 2, 2022, ends on a bearish note for the SOL token with very high chances of retesting lower $30s.