Solana prints a sideways trading pattern: How to find the perfect entry point?
Solana price analysis for July 6, 2022, comes on a bearish note for one of the biggest cryptocurrencies in the crypto space and we can confirm that the SOL coin is printing a sideways trend and hence, investors can expect the token to drop in the near future if the bulls don’t reclaim dominance over the price action.
Additionally, as noted in our SOL price analysis for July 5, 2022, we can expect the SOL token to make higher highs in the coming days if the $40 price level is turned into a support level and the bulls take control overall. Interestingly, we can also expect SOL to drop below $30 if the trading volume remains low.
The data from CoinMarketCap shows that the trading volume for SOL surged by 31.64% in the last 24 hours, followed by a 1.20% drop in the market cap. The Market Dominance of the Solana token rose to 1.36%, while the Volume / Market Cap Ratio stands at 0.133.
The daily candle for Solana was initiated at a price of $35.41 and reached a daily high of $36.50. Furthermore, the daily low for SOL was seen at $34.80, while the price of 1 SOL at the time of writing was $35.44.
Solana price analysis from the daily chart for July 6
Solana price analysis for July 6, 2022, will take into account the data from the daily chart below and 3 major indicators integrated into it.
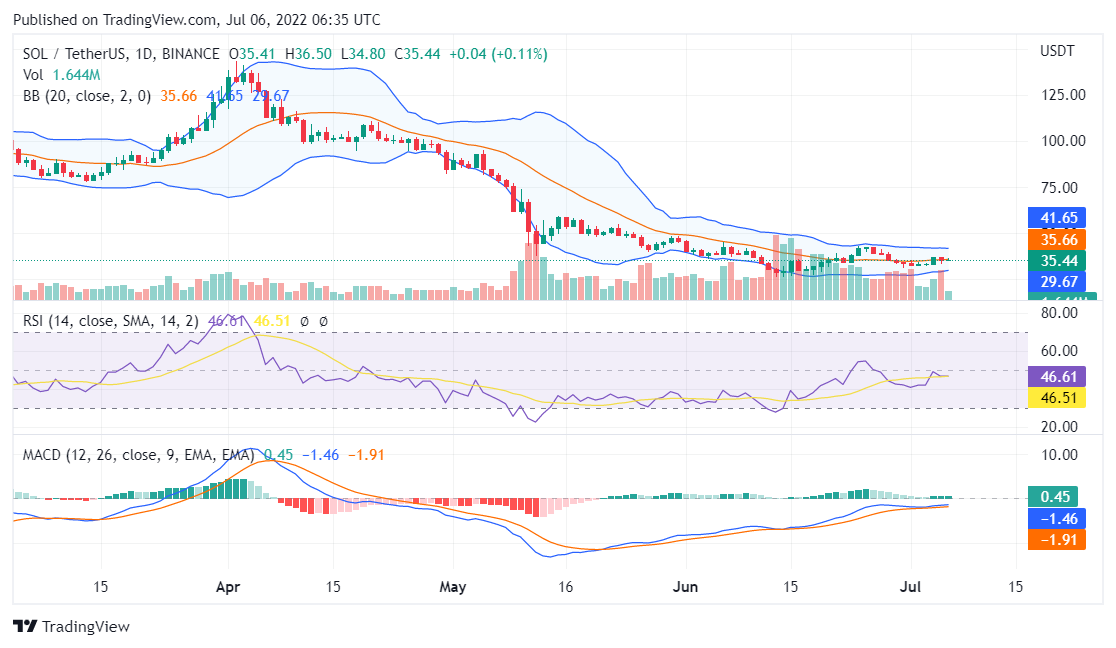
Source: TradingView
The MACD indicator shows that the MACD line and the signal line remain very close to each other and the sluggish movement continues.
The RSI indicator for Solana reads a value below 47 which confirms that overall, the bears are in control.
The price action for Solana is retesting the middle zone of the Bollinger Bands and a breakout into the bearish region is possible.
Conclusion
Solana price analysis for July 6, 2022, ends on a bearish note for SOL with considerable chances of revisiting $30.