Solana remains sluggish as bears aim towards $40
Solana price analysis for June 1, 2022, comes on a bearish note for the token with increased chances of retesting the $40 price level in the next 24 hours if the bulls don’t take over the price action soon. Furthermore, we have also noted in our SOL price analysis for May 31, 2022, that the token has major resistance toward the $50 price region which was previously a major support region for the token. For now, the support for the price action rests at $40 which needs to hold or else, we might another crash for the token.
The data from CoinMarketCap shows that the trading volume for SOL dropped by 27.51% in the last 24 hours, followed by a 2.19% drop in the market cap. The Market Dominance of the Solana token dropped to 1.17%, while the Volume / Market Cap Ratio stands at 0.08039.
The daily candle for Solana was initiated at a price of $45.78 and reached a daily high of $46.12. Furthermore, the daily low for SOL was seen at $44.34, while the price of 1 SOL at the time of writing was $45.20.
Solana price analysis from the daily chart for June 1
Solana price analysis for June 1, 2022, will take into account the data from the daily chart below and 3 major indicators integrated into it.
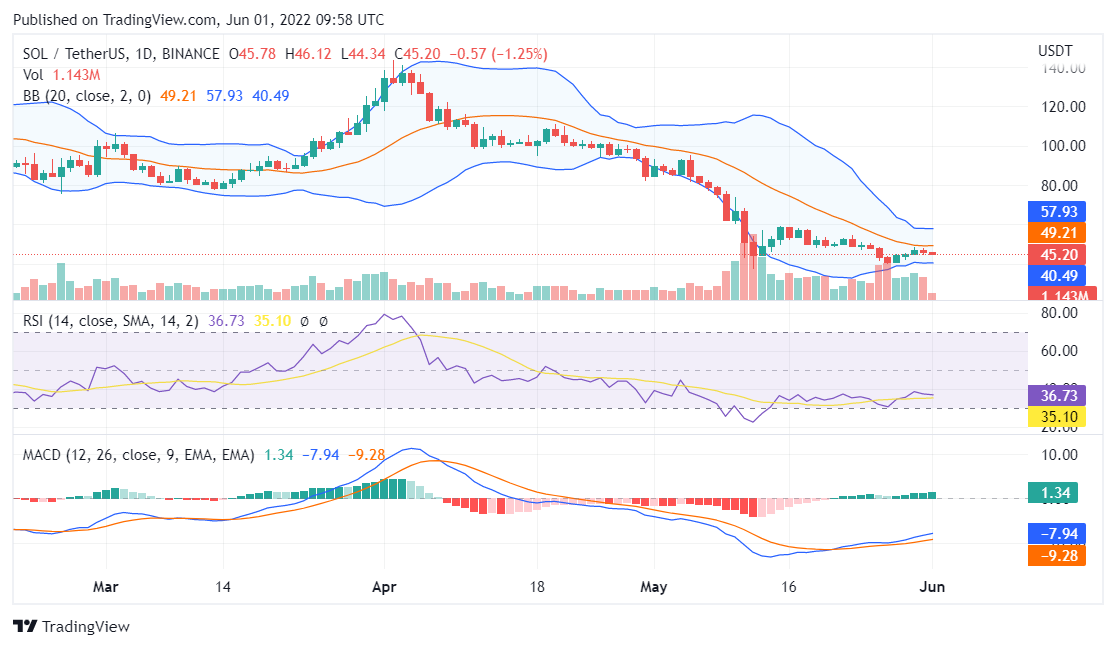
Source: TradingView
The MACD indicator shows that the MACD line is above the signal line while the MACD histogram remains bullish.
The RSI indicator reads a value below 37 which confirms that bears are still in control of the price action while the gradient of the line suggests that lower prices will follow.
The price action for Solana is situated at the lower end of the Bollinger Bands and the position of the price action suggests that lower prices are possible.
Conclusion
Solana price analysis for June 1, 2022, ends on a slightly bearish note for the SOL token with high chances of retesting $40 in the near future.