Solana price analysis for June 15, 2022, comes on a bearish note for the SOL coin as the chances of the token breaking the $30 price region in the short term remain low. In the past 24 hours, we have seen SOL drop more than 9% in prices and it seems that the sellers continue to dominate in the short term. As noted in our SOL price analysis for June 14, 2022, the SOL coin has made attempts to reclaim the $30 price region but it seems that the buying pressure is not enough to do so.
The data from CoinMarketCap shows that the trading volume for SOL dropped by 34.49% in the last 24 hours, followed by a 10.39% surge in the market cap. The Market Dominance of the Solana token rose to 1.07%, while the Volume / Market Cap Ratio stands at 0.1933.
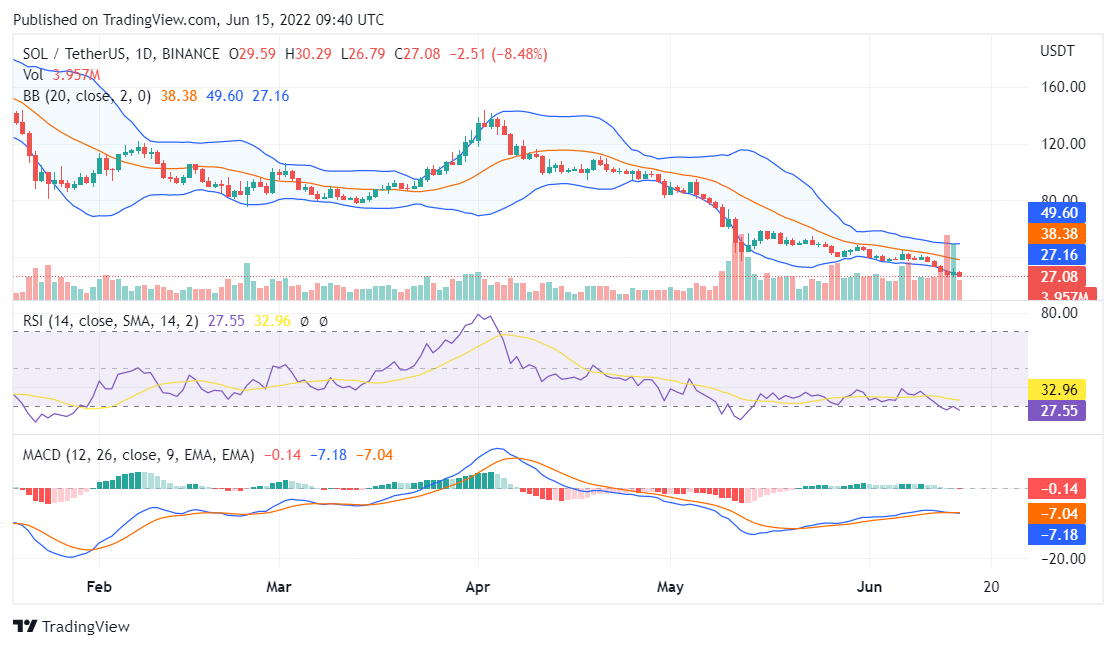
The daily candle for Solana was initiated at a price of $29.59 and reached a daily high of $30.29. Furthermore, the daily low for SOL was seen at $26.79, while the price of 1 SOL at the time of writing was $27.08.
Solana price analysis from the daily chart for June 15
Solana price analysis for June 15, 2022, will take into account the data from the daily chart below and 3 major indicators integrated into it.
Source: TradingView
The MACD indicator shows that the MACD line is touching the signal line and if the prices drop further, a bearish divergence will be confirmed.
The RSI indicator reads a value below 28 which confirms that the bears are in control and the gradient of the line suggests that sluggish movement will follow.
The price action for Solana aims to break out from the lower region of the Bollinger Bands but the buyers are giving it their all to prevent that.
Conclusion
Solana price analysis for June 15, 2022, ends on a bearish note for SOL with low chances of the SOL breaking $30.
Canary Capital Staked INJ ETF entered focus after the firm filed..
BlockchainFX is the world’s first crypto exchange connecting traditional finance with blockchain. Join the $BFX presale today and secure your chance for 100x gains!