

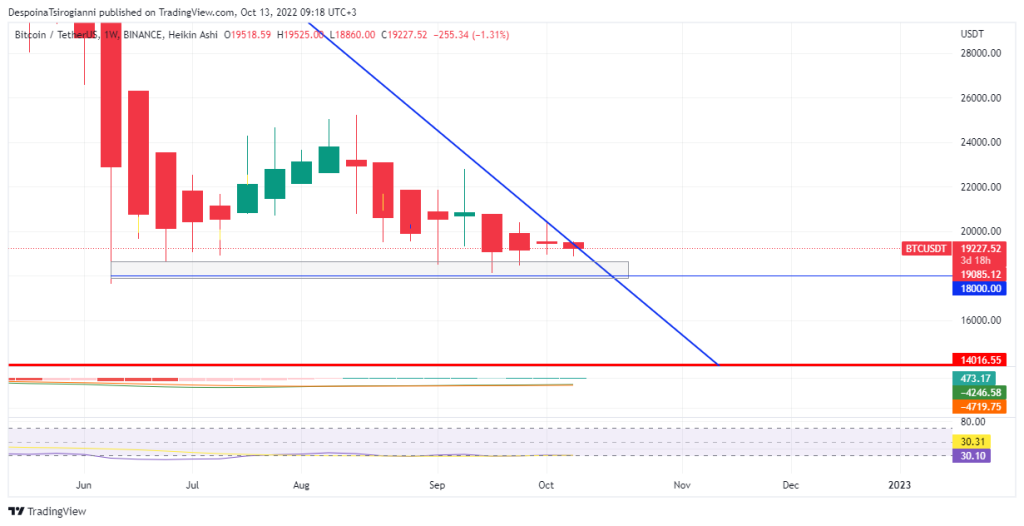
Bitcoin price analysis for 13 October 2022, Bitcoin, the first largest cryptocurrency based on market cap, is in a downtrend since November 2021. On the fourth day of this week, it seems that the price is under the sellers’ control based on the weekly Heikin Ashi Candlestick. The weekly MACD is still negative but forms a positive histogram. The weekly RSI fluctuates below 50 but is close to the overbought zone. The price is still under the 50 SMMA line.
 Bitcoin price analysis on the Daily Chart for 13 October 2022
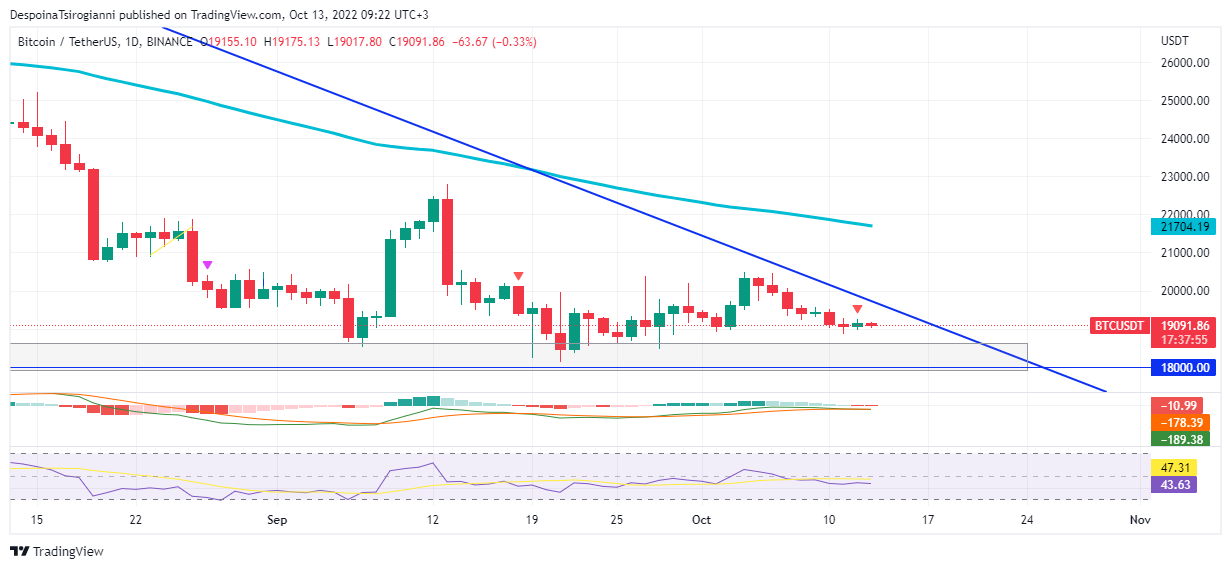
 By diving into the daily timeframe, the price fluctuates close to the downtrend trendline.
The TFLOW V2 Algo has already generated a Short Daily signal.
The Daily MACD indicator fluctuates in negative numbers.
The Daily RSI fluctuates under 50.
The 50 Daily SMMA stands above the price which means that the bears control the price.
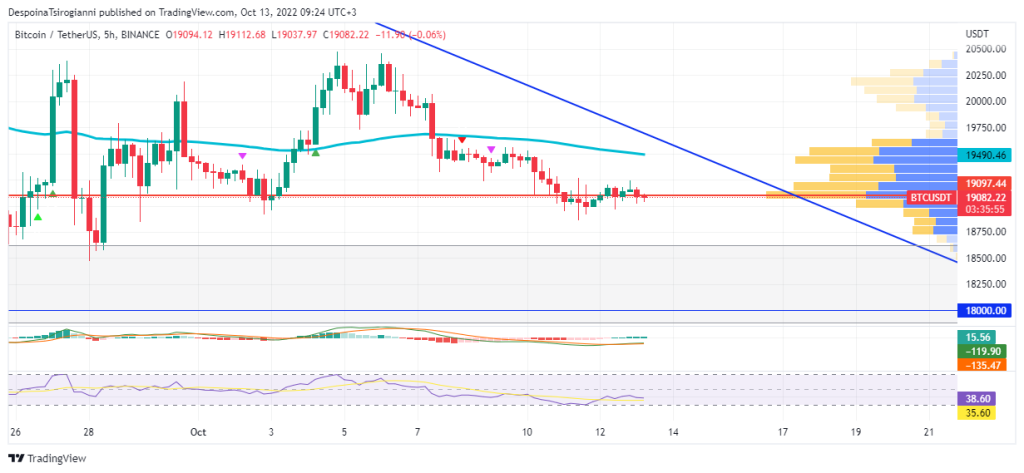
In the 5-hour chart, Bitcoin dropped after reaching the downtrend trendline area. The price fluctuates below the 50 SMMA line of $19490.46. The Volume Profile indicator determines $19097.44 as a strong trading area, which can act as support or resistance.
The 5-hour MACD is negative with a positive histogram. The 5-hour RSI fluctuates below 50.
Conclusion
The price of Bitcoin forms a bearish momentum in medium-term scale as the technical analysis and the indicators coincide. In a short-term scale, it seems that sellers try to push the price lower, but the price encounters strong trading areas. An upside movement back to the 50 SMMA is very likely.
Read all the latest Crypto Analysis Articles here.
Join the TFLOW Trading Community: https://t.me/tflowglobal
Read More
All News
December 17, 2025

December 17, 2025

December 17, 2025

BlockchainFX is the world’s first crypto exchange connecting traditional finance with blockchain. Join the $BFX presale today and secure your chance for 100x gains!
Join Now