


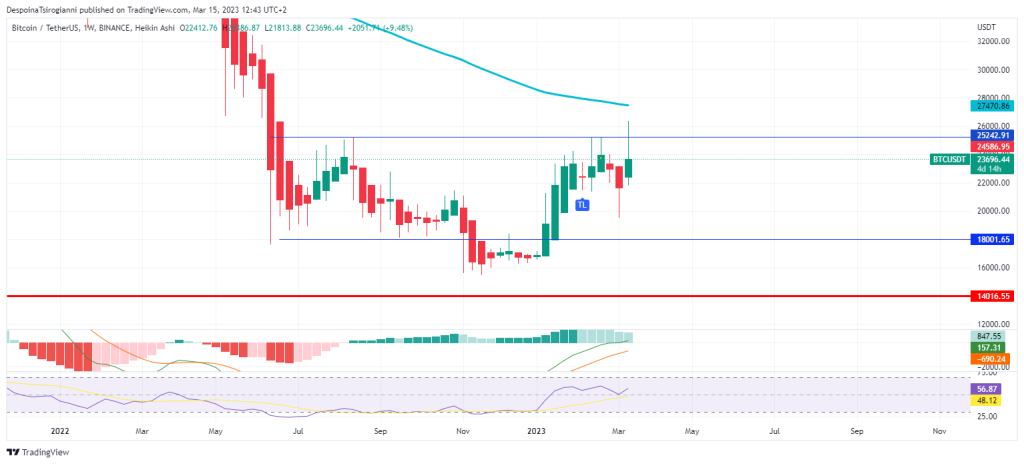
Bitcoin price analysis for 15 March 2023, Bitcoin, the first largest cryptocurrency based on market cap, is in a downtrend since November 2021. You can read more about Bitcoin price from CoinCodex. On the third day of this week, it seems that pressure tries to balance between buyers and sellers based on the weekly Heikin Ashi Candlestick. The weekly MACD is still negative but forms a positive histogram. The weekly RSI is over 50 areas. The price is still under the 50 SMMA line.
Bitcoin price analysis on the Daily Chart for 15 March 2023
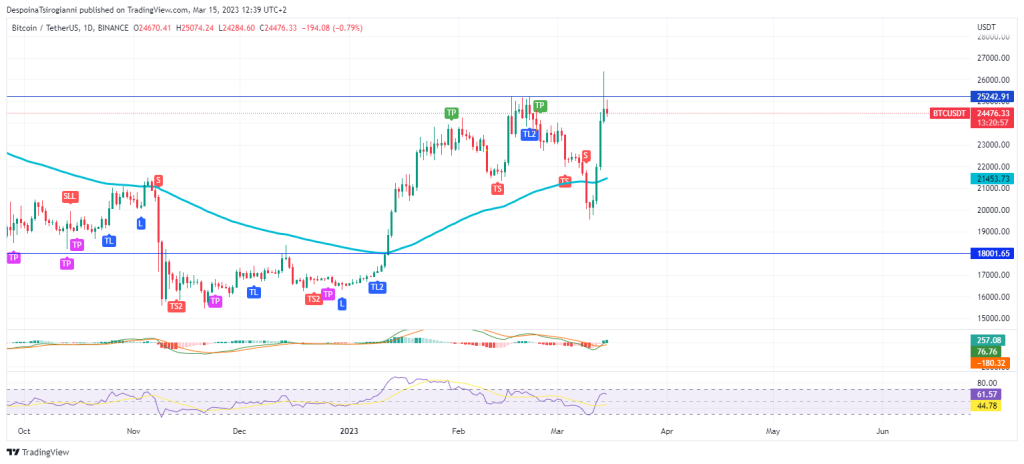
By diving into the daily timeframe, the price surpasses the daily 50 SMMA line ($21453.73). Buyers push the price close to previous resistance zones. Be aware of PPI news today.
The TFLOW V3 Algo has already generated a Short signal.
The Daily MACD slightly turns positive.
The Daily RSI fluctuates over 50.
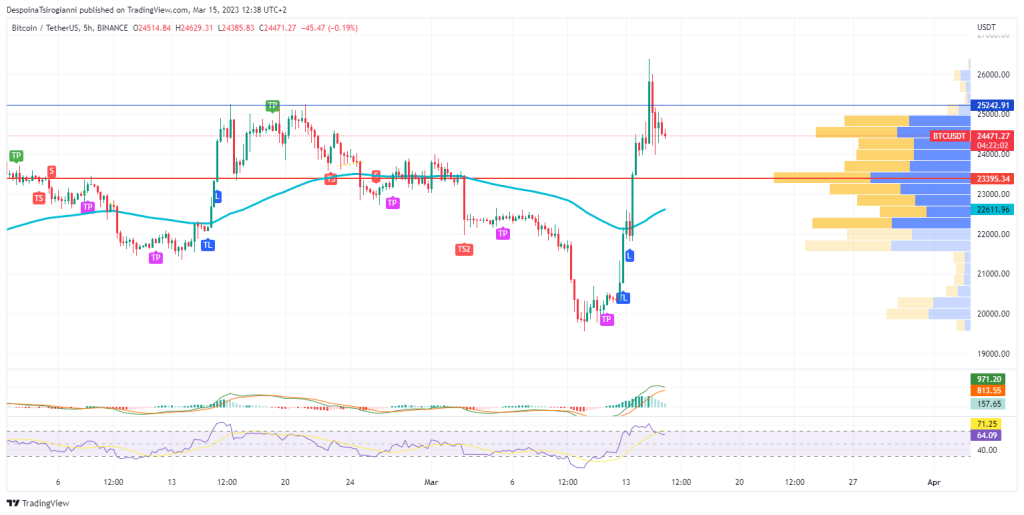
In the 5-hour chart, Bitcoin fluctuates over the 50 SMMA line of $22611.96 and the Volume Profile indicator that determines $23395.34 as a strong trading area.
The 5-hour MACD is positive. Moreover, the 5-hour RSI fluctuates over 50 and close to the overbought zone.
Conclusion
The price of Bitcoin forms a bearish momentum in a medium-term scale as the technical analysis and the indicators coincide. In a short-term scale, buyers push the price close to previous resistance areas. We observe the current area for price reaction.
Read all the latest Crypto Analysis Articles here.
Join the TFLOW Trading Community: https://t.me/tflowglobal
Read More
All News
December 23, 2025

December 23, 2025

December 23, 2025

BlockchainFX is the world’s first crypto exchange connecting traditional finance with blockchain. Join the $BFX presale today and secure your chance for 100x gains!
Join Now